"Chart" is this article's theme. We will introduce to you steps required when you give it a try for outputting a PowerPoint file with charts.
In this article, you use a sample "Opportunity" app, a zip file of which is attached to this article (you can find it at the bottom), to output a chart indicating monthly sales.
For starters, create a PowerPoint file with chart settings. Let's start creating a template from a blank state!
Table of Contents:
1. Add-in Settings
Open a blank PowerPoint file and install an add-in "Document Designer for Office".
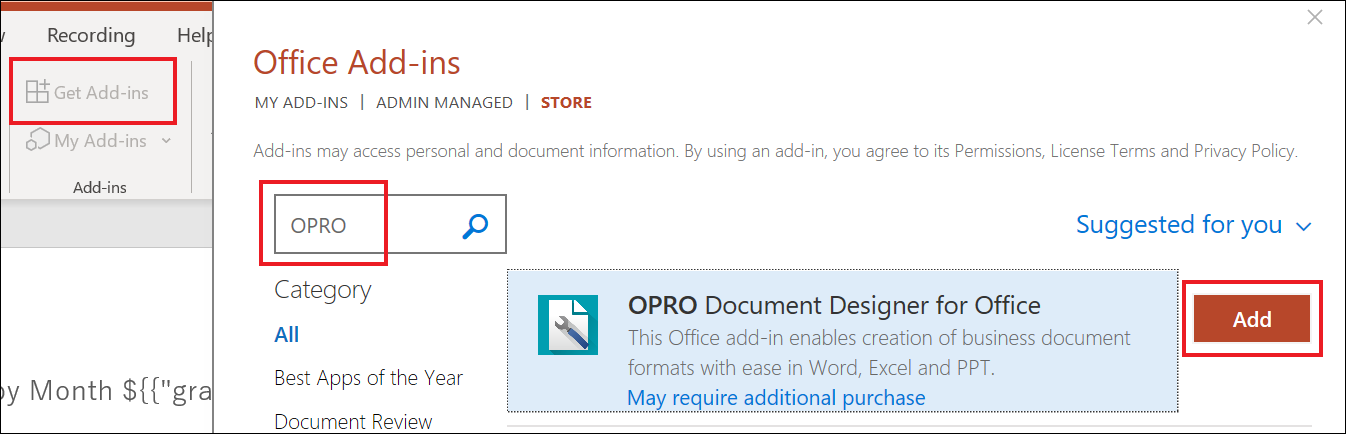
Go to the add-in store from "Get Add-ins" in "Insert" tab.
Search for the add-in by "OPRO", then add it.
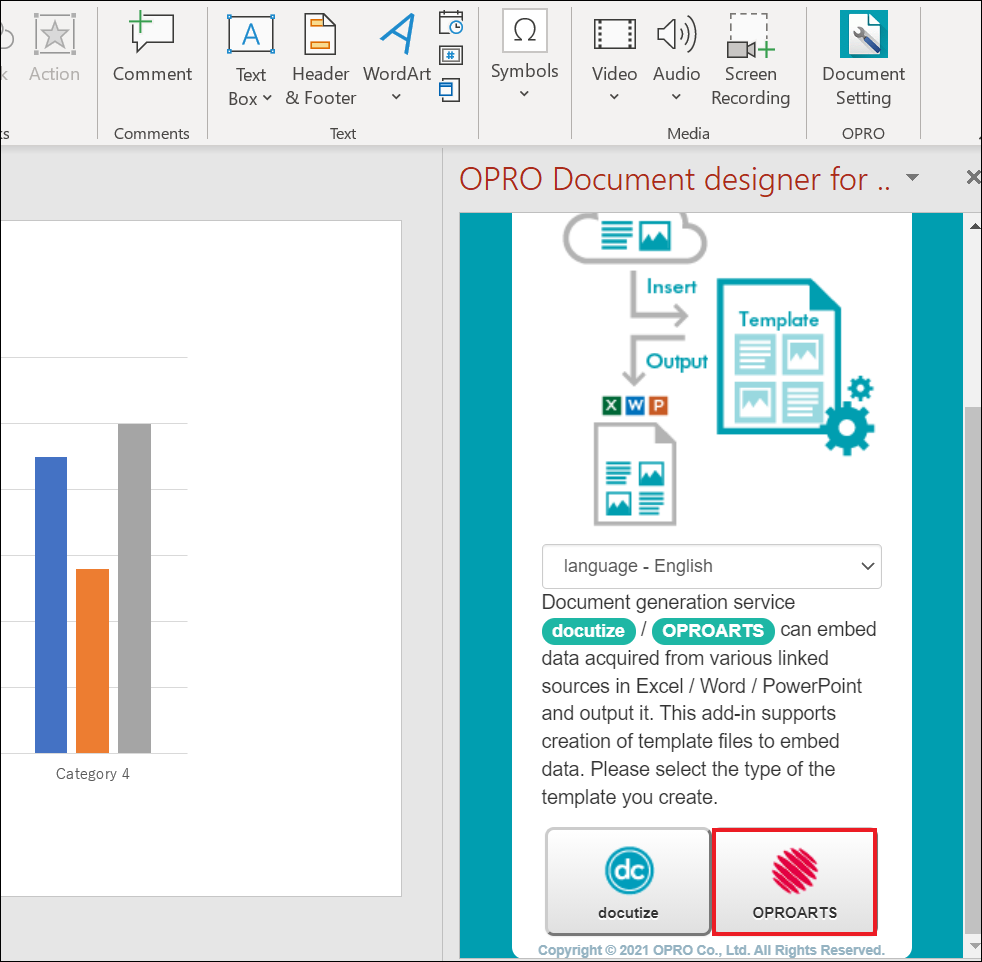
Adding this add-in shows the icon of it in "Insert" tab. Click it.
The start screen opens, so choose "OPROARTS".
2. Field Settings
If you output forms using Docutone, you need to create form templates of "Header-Items" (where detail lines and other parts of a form are configured separately) type.
Since you will a chart which only includes detail items (multiple records in kintone), set some dummy values for parts other than the detail items.
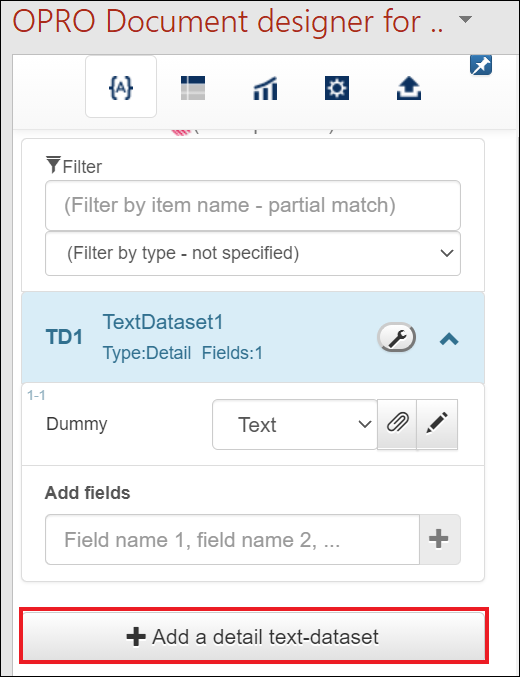
Enter "Dummy" in "Add fields" section in TextDataset1, and click [+] to create a dummy field.
Just creating it is OK because the value in this field won't be displayed in slides in a PowerPoint file.

Then, to configure the detail items (charts), click [Add a detail text-dataset] > [Add] to add TextDataset2 to the template file.
Let's move on to chart settings.
Suppose that you want to display total amounts for each month in a column chart.
Choose a column chart from "Chart" menu in "Insert" tab and insert it.
(Choose from charts listed in "Kinds of Charts Available for PowerPoint File Output".)

"Category Name" is set for the horizontal axis as its default value.
This time, set "Opportunity" app's "Amount" field for the vertical axis and the "Month" of complete plan date for the horizontal axis.
To acquire "Amount" and "Month" data from kintone, enter "Amount,Month" into "Add fields" section of TD2 and click "+" button.
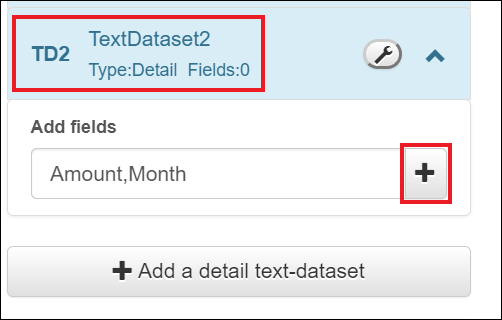
All necessary fields are created.
Change the data type of amount to "Number", not "Text". Leave the month field as it is.

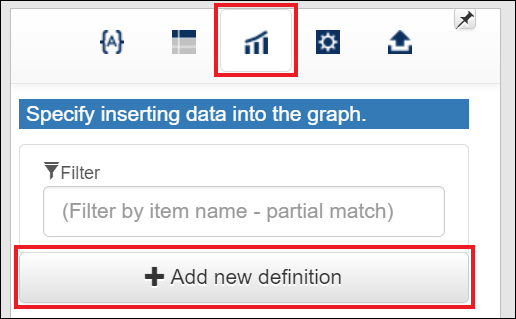
Click a tab with a chart mark to open the chart settings tab.
Click "Add new definition".
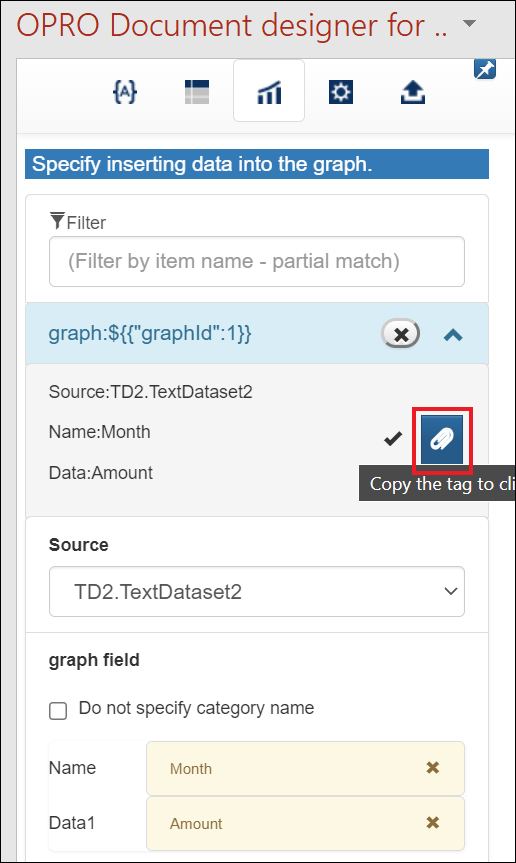
After adding a chart definition, select "TextDataset2" as a quote source.
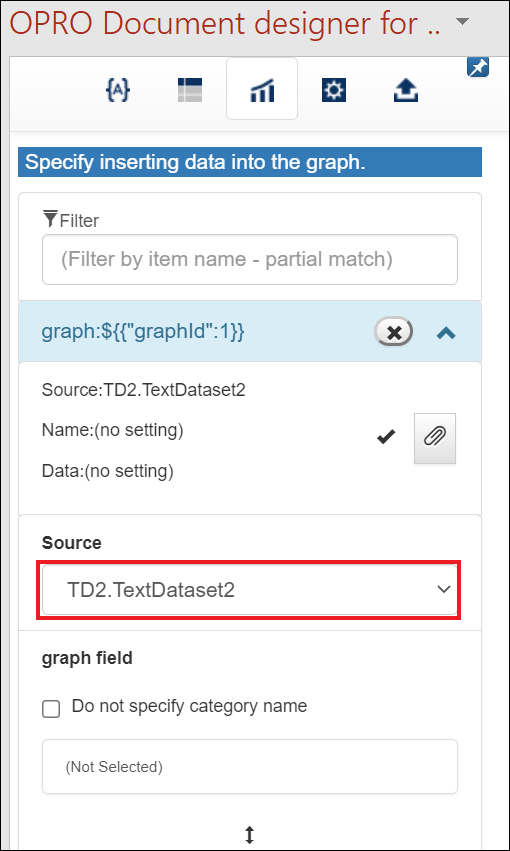
Scroll down a little bit and specify "Category" of the chart.
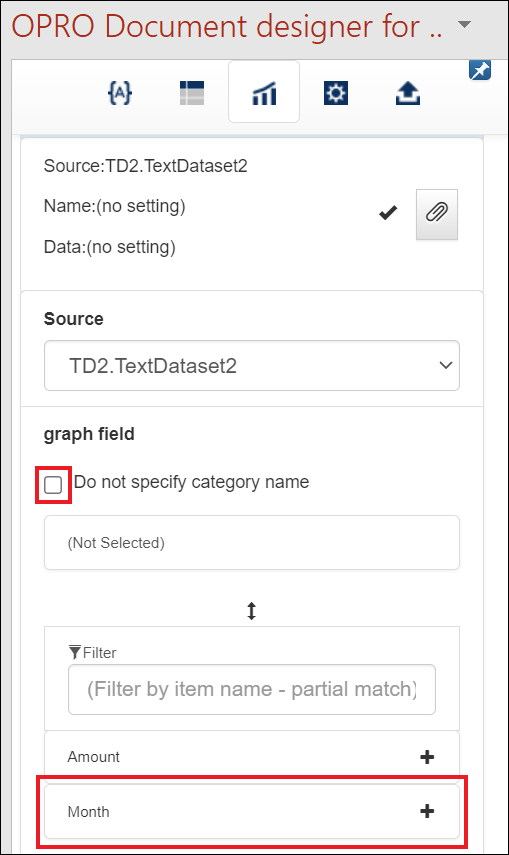
In case of a column chart, which has a horizontal axis (category) and a vertical axis, keep "Do not specify category name" unchecked.
Since "Category" is displayed in the horizontal axis, choose "Month".
"Month" is set as category names (horizontal axis). Go on to select "Amount".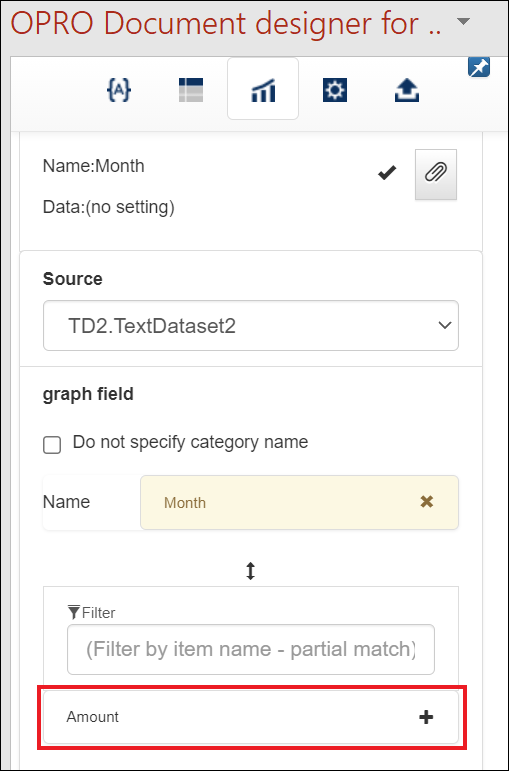
"Amount" is set as Data1. This makes amount appear in the chart.
Click the clip button to copy a tag that represents this chart settings.
Paste the copied tag into the frame of the chart title.

All setting are done!
Save this PowerPoint file and upload it to Designer.
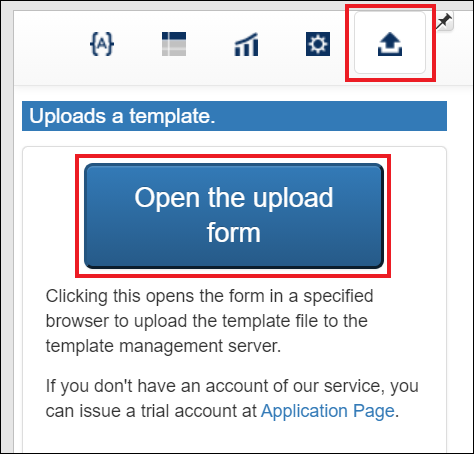
Click the upload tab in the add-in and click "Open the upload form".
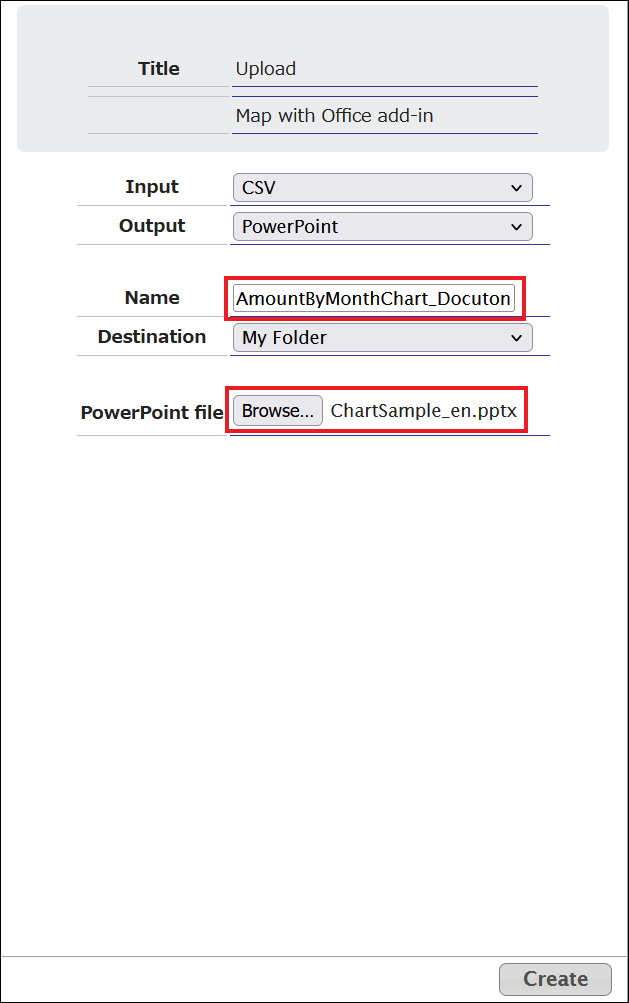
Name the template, attach the saved PowerPoint file and click "Create" at the lower-right corner to save.
* It is possible to reach the same upload menu by the following route.
In Docutone app, click [START] button > [Create New] button >"PowerPoint">"Upload"
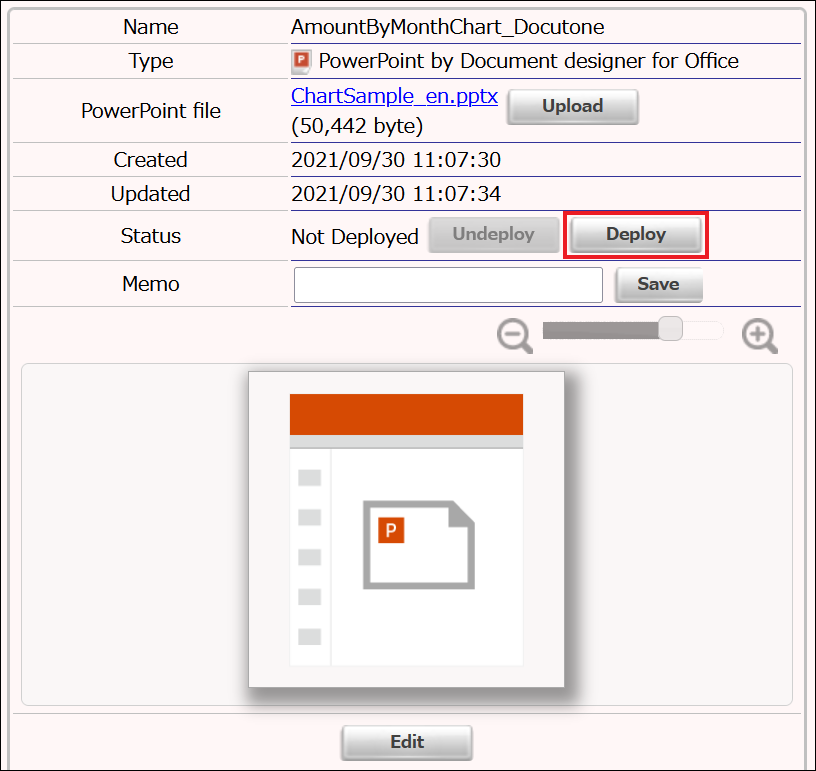
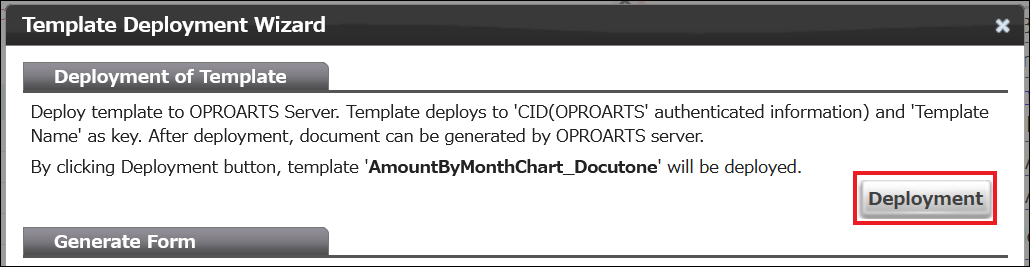
After the template is generated, click "Deploy" -> click "Deployment" to deploy the template to OPROARTS server.
3. Docutone Settings
Link the template to kintone apps in "Docutone" app.
The template you created in the previous chapter has both "Header" (like a parent, not-repeatable area) and "Items" (like children, repeatable area).
While "Opportunity" app should be linked to "Items", there is no kintone app which is supposed to be linked to "Header" part.
So you need to create a dummy app for a header part and to prepare a field in "Opportunity" app which links itself to the dummy header app.
(1) Add two fields to your target app.
* If you're trying steps using "Opportunity" app attached as a ZIP file in this article, this step is unnecessary.
1. Add a Calculated field to the app.
Enter "1" for the formula to make sure the returned value is always 1.

2. Create a field that converts date values into strings in YYYY/MM format.
Put a text field and check "Calculate automatically", then enter this formula.
DATE_FORMAT(CloseDate, "YYYY/MM", "Etc/GMT")

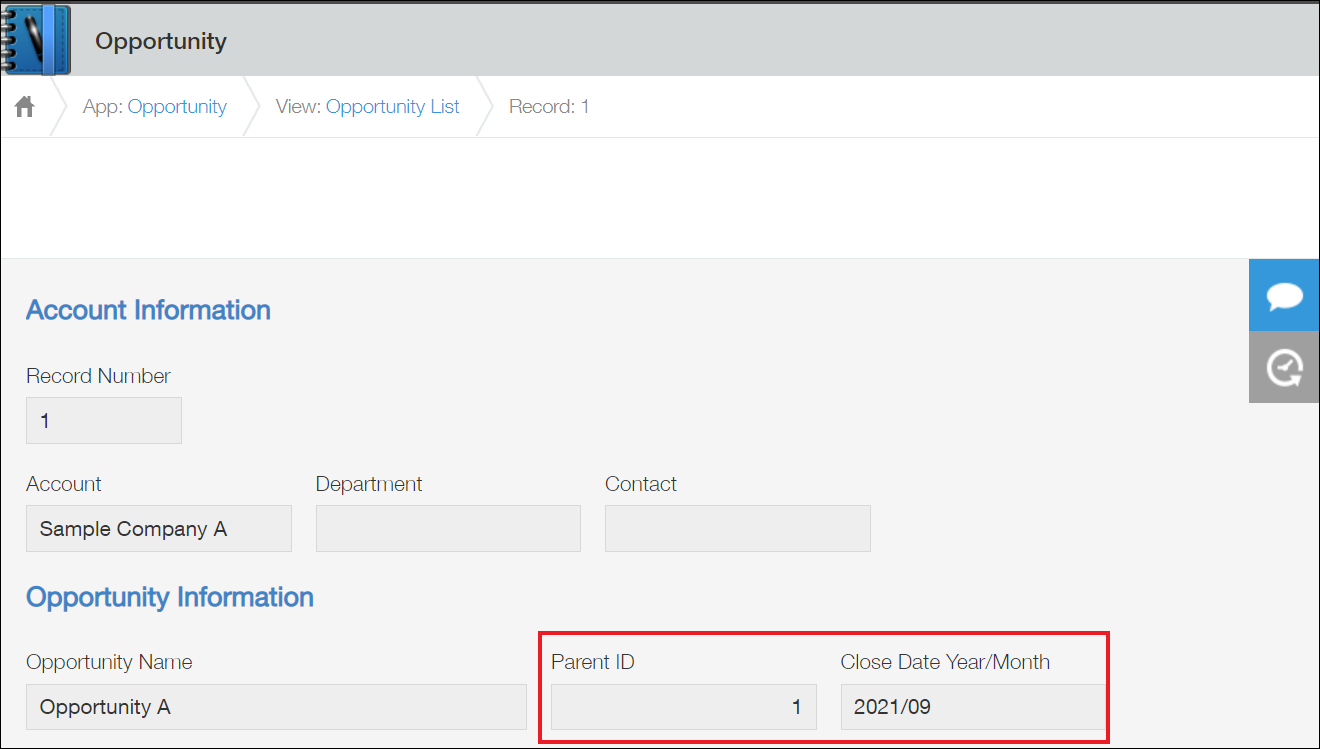
Just adding those fields doesn't change each record's value, so edit & save a record to display calculation results.
Calculation results are like below.
(2) Create an App for Form Headers
Create an app for form headers (not displayed, dummy data) from scratch.
Then create a formula field on the app so that the calculation result is always "1".

(3) Create a Form Output Button
Create a form output button on the header app you created in step (2).
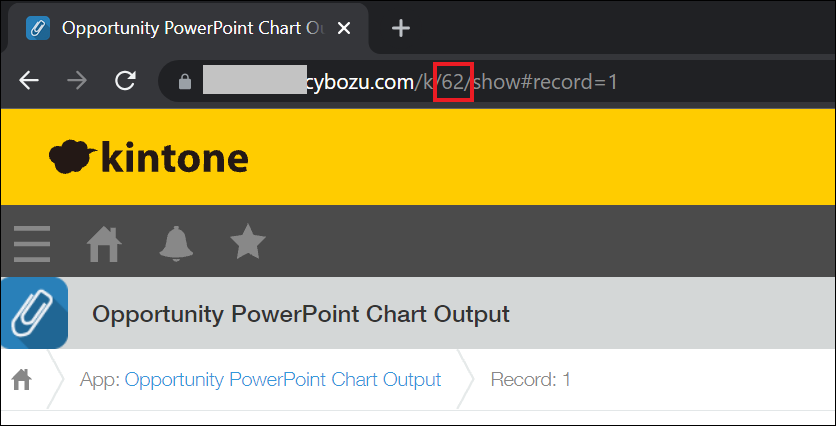
Check the id of the app. In an example below, the id of the header app is "62".
Also check the id of "Opportunity" app in the same way.
So, let's create the button.
1. Open a "LAD" record in "Docutone" app or "OPROARTS Connector for kintone" app.
2. Click "Sync" to get the latest template information.
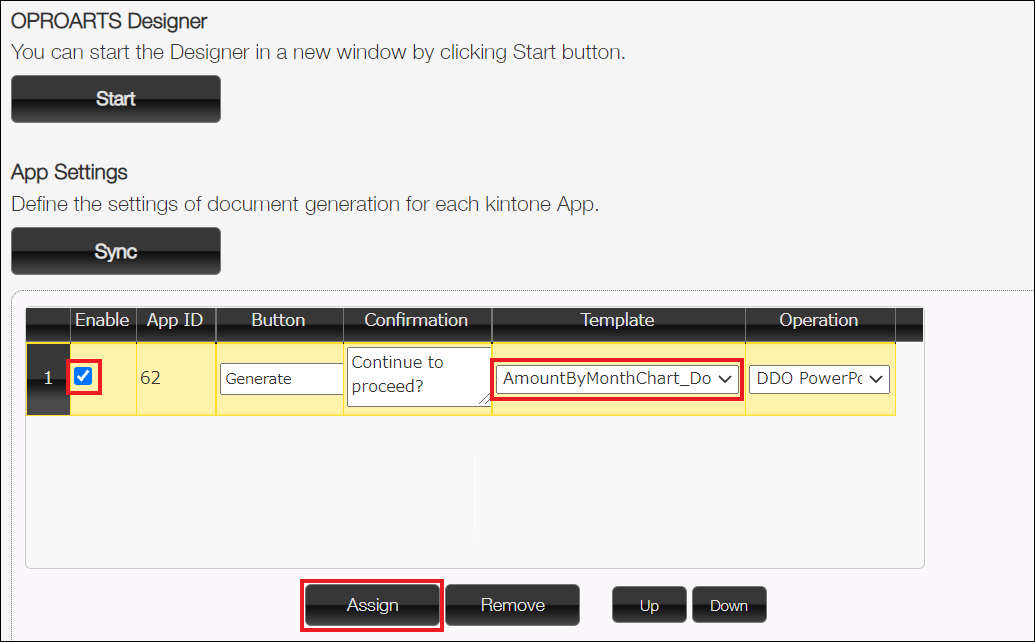
3. Click "Add" and enter the id of the header app.(In an example above, "62")
4. Check "Enable" and select the PowerPoint template.
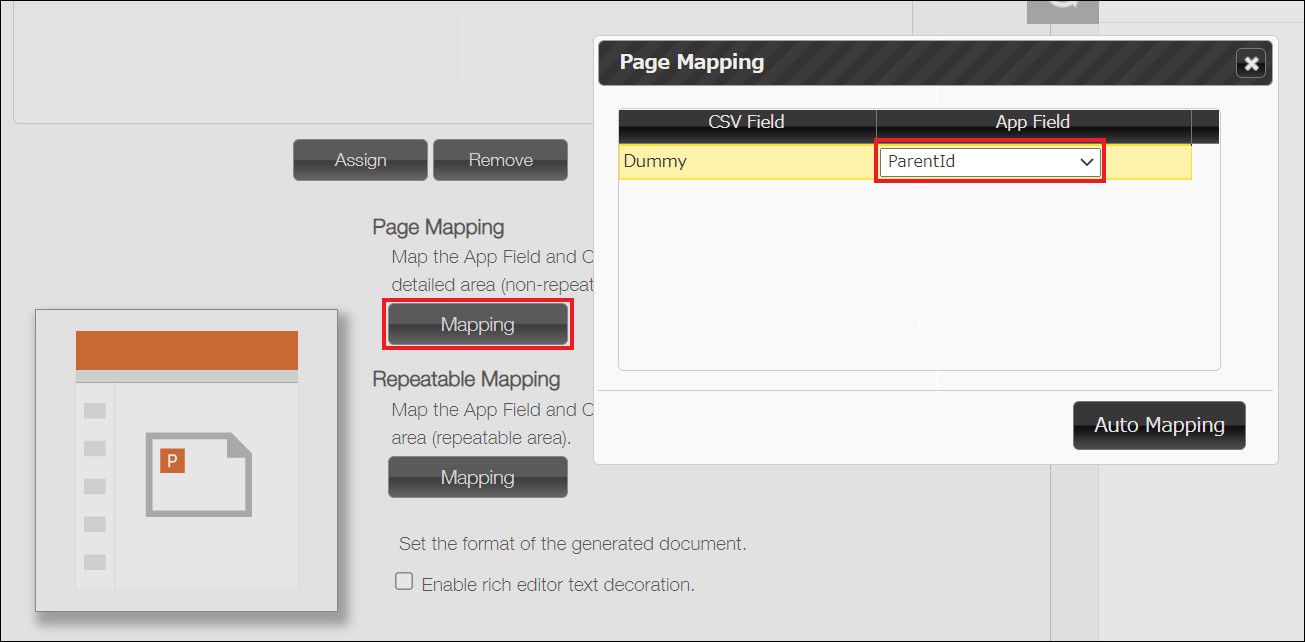
5. Click "Mapping" button in Page Mapping section and link a field (whatever field is OK) to the dummy field.
Once you're done, click "x" to close the popup.
6. Click "Mapping" button in Repeatable Mapping section, check "Use Related Records" and click "Setting", and related-record-settings screen (settings for the apps other than the one you specified in step 3.) will open.
Enter the id of "Opportunity" app and set this condition.
Opportunity's "Parent ID" = "Parent ID"
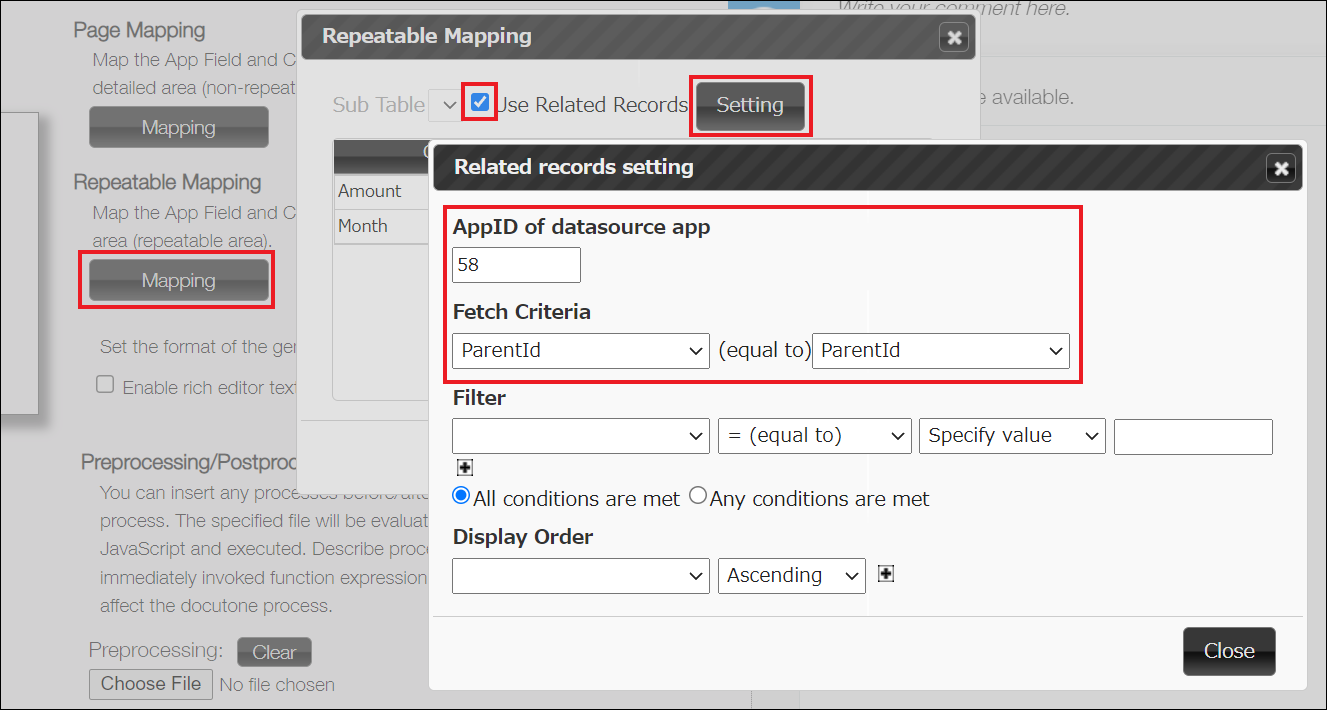
Once you've set the condition formula, click "Close".
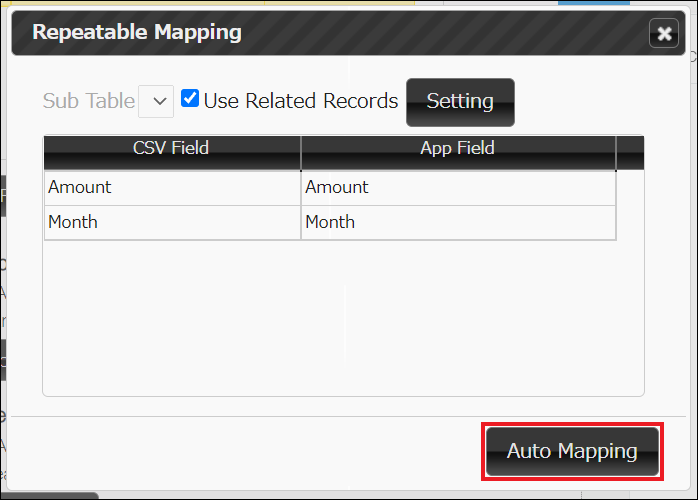
7. Click "Auto Mapping".
If the names of fields specified in the PowerPoint add-in are matched to the field names of "Opportunity" app, they are automatically linked to each other.
Close this popup with "x" button.
8. Scroll down to the bottom and click "Save".
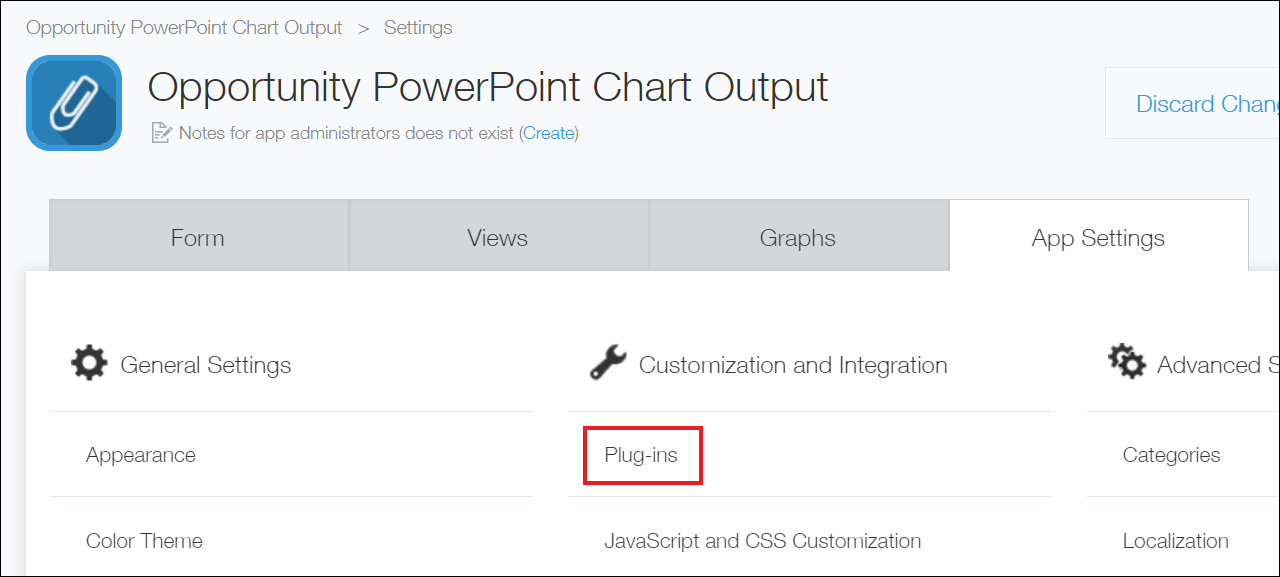
9. In the header app, open "Settings" > "Apps Settings" tab and select "Plug-ins".
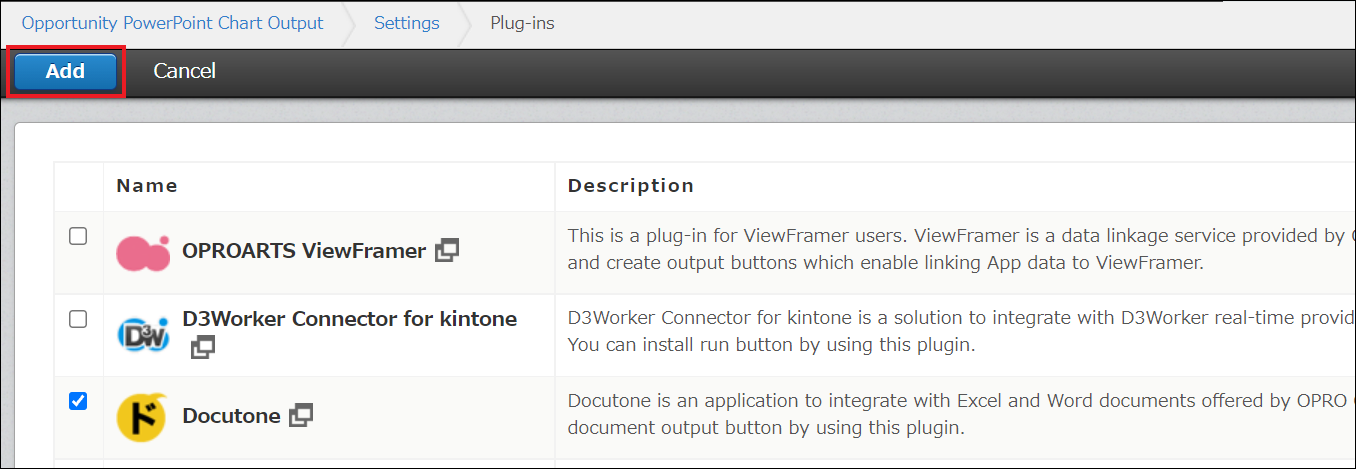
From "Add plug-in" at upper-left corner, select "Docutone" or "OPROARTS Connector for kintone" plug-in and click "Add".

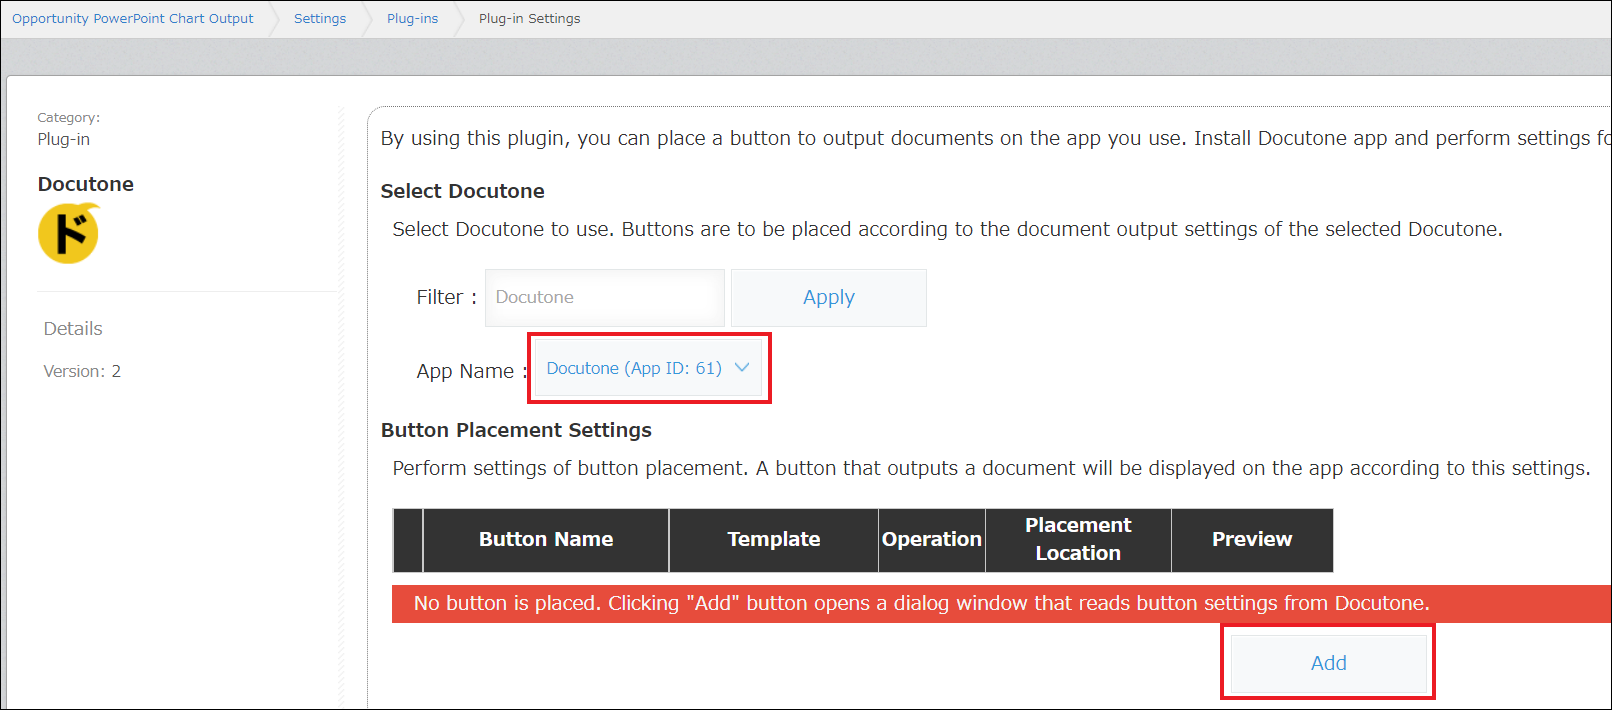
10. Click the gear icon of the app you added in step 9, and an settings screen will open.
![]()
Select "Docutone" or "OPROARTS Connector for kintone" app, click "Add" and select the PowerPoint output button you created.

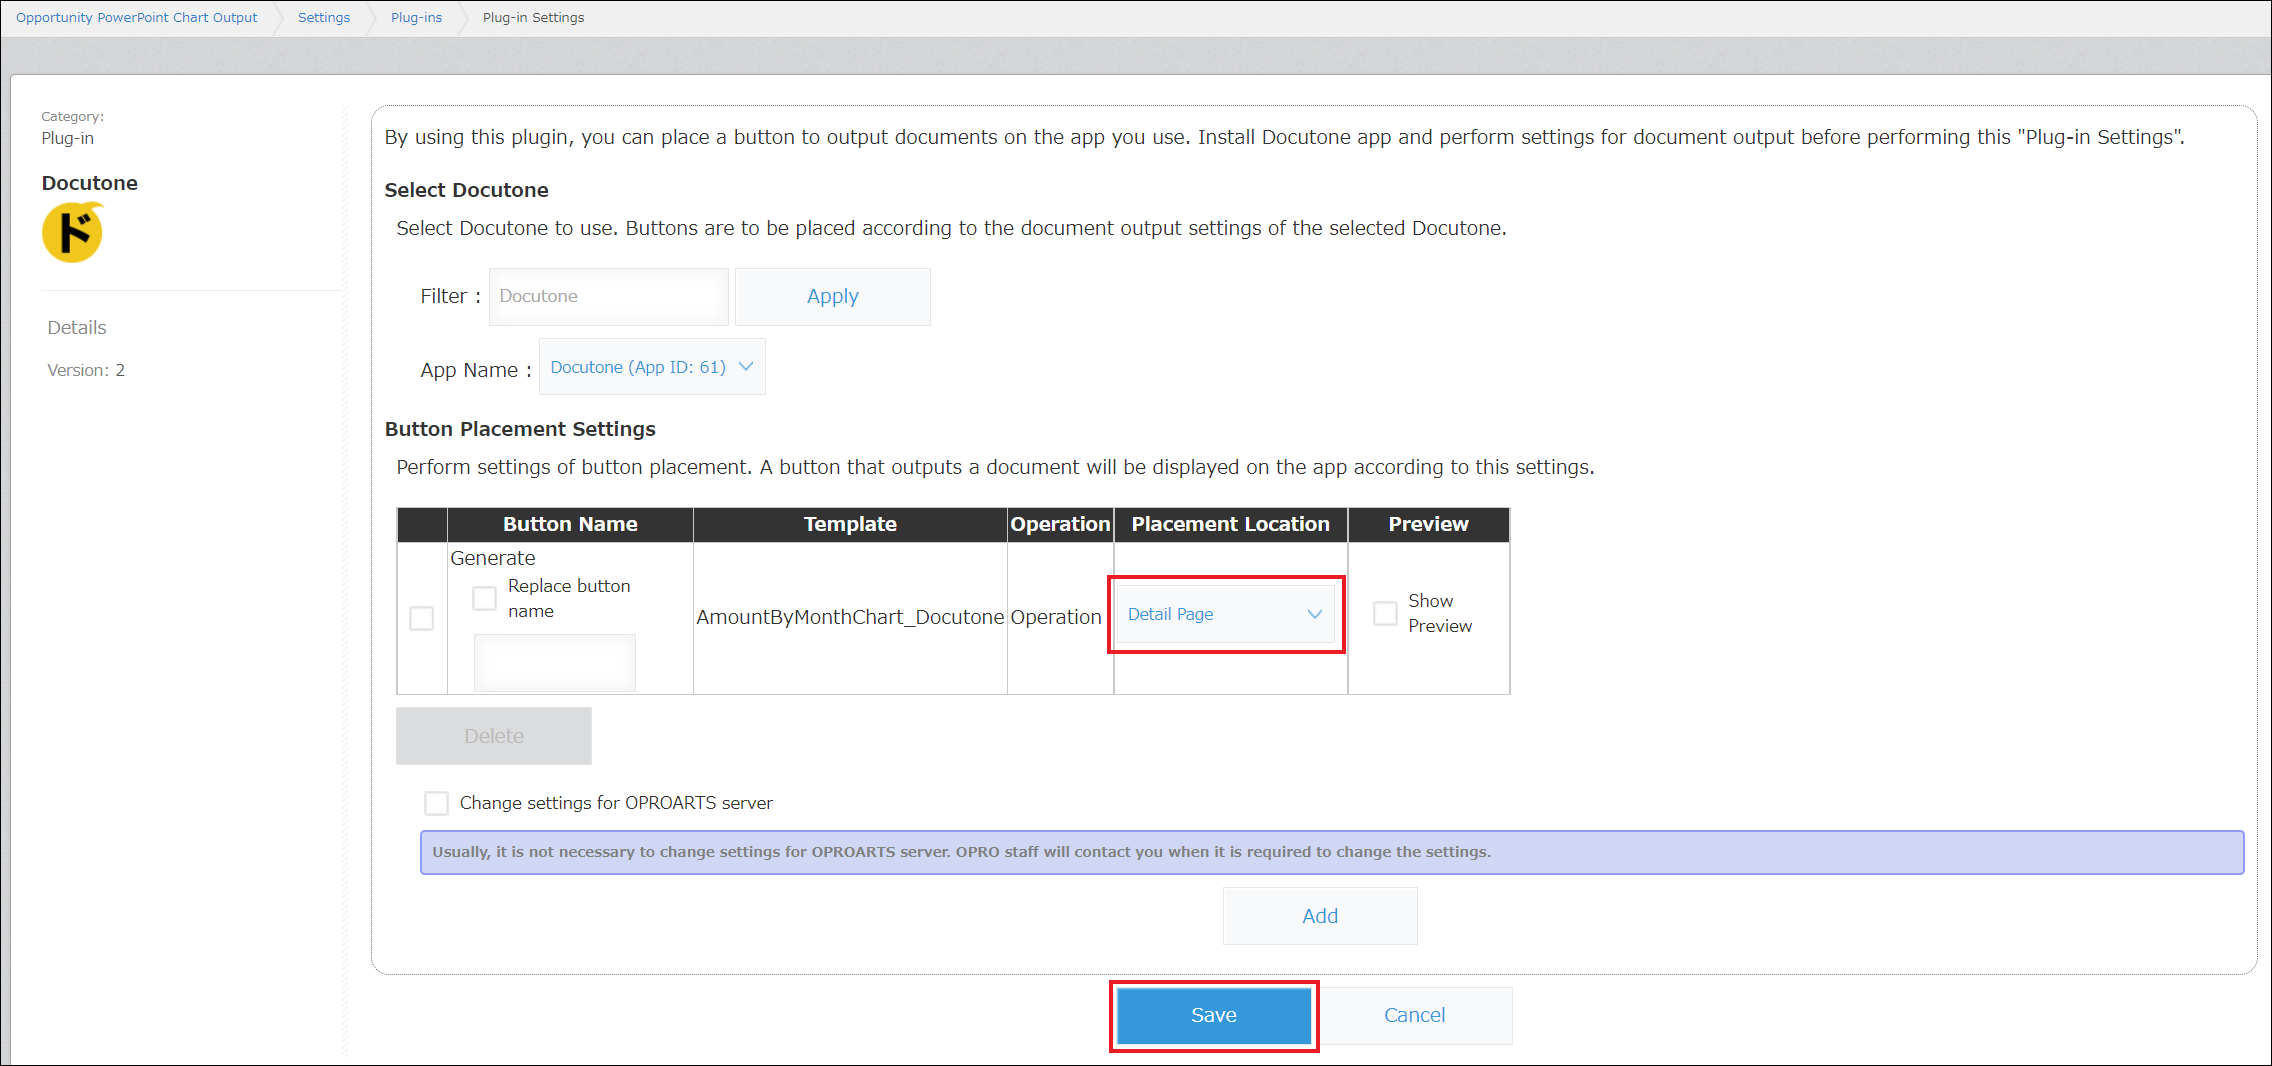
Configure so that the button is put on a record detail screen (which is default), save the settings.
11. Go back to the setting screen of the header app and click "Update App".
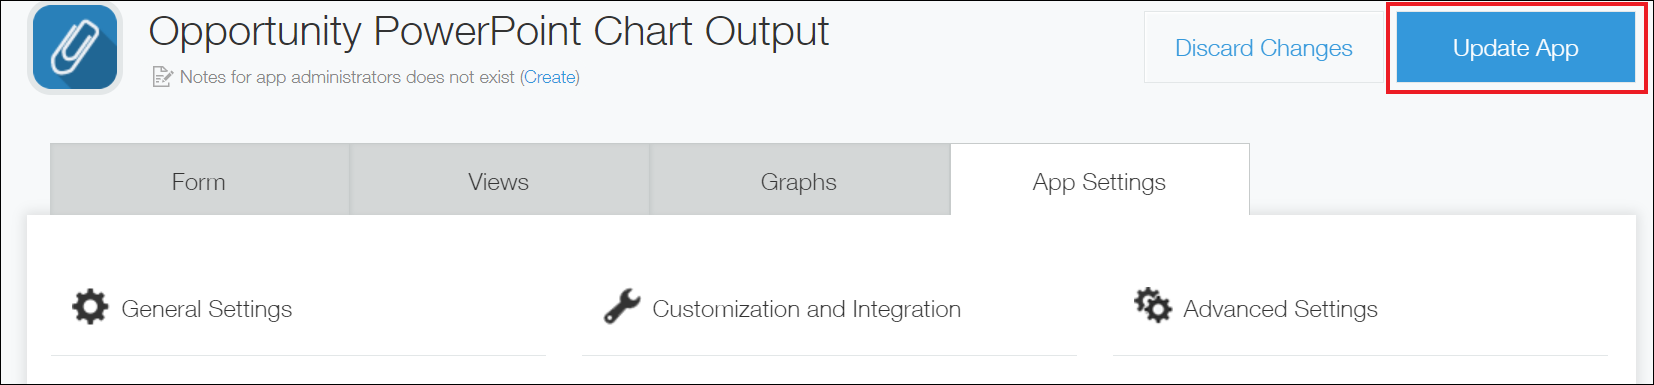
Open a record of the app for form headers (any record is OK), click the output button, then you can output a PowerPoint file!
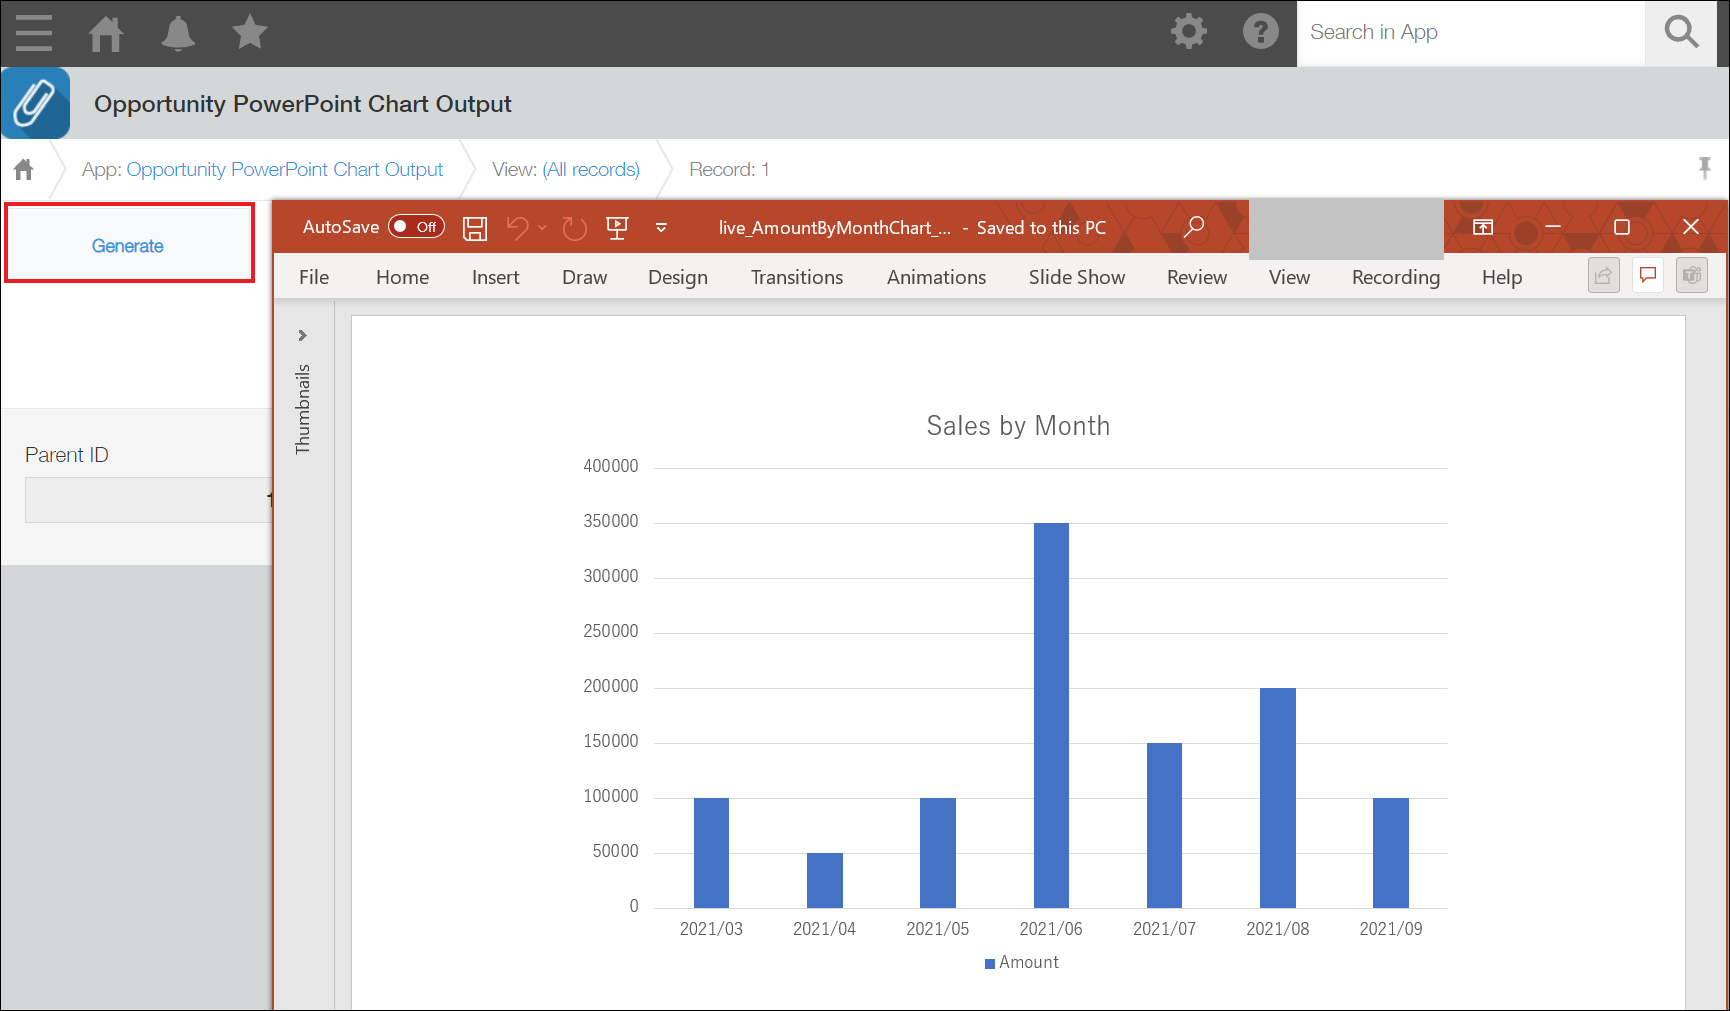
This time, we used a simple chart as an example.
You can also insert a line chart, a pie chart, etc.
* Another service "ViewFramer" of ours can be used to aggregate amounts by category name.
The template sample introduced in this article is attached to the bottom of this article.
You can use it freely, so don't hesitate to use it if you want to.