"Chart" is this article's theme.
Suppose that you are going to show a column chart that represents "Total Amount" of opportunity records in Salesforce the phase of which are "Closed Won".
Set up procedure includes PowerPoint settings and ViewFramer settings.
To begin with, let's set up a PowerPoint template file from a blank state.
Table of Contents:
1. Add-in Settings
Open a blank PowerPoint file and install an add-in "Document Designer for Office".
Go to the add-in store from "Get Add-ins" in "Insert" tab.
Search for the add-in by "OPRO", then add it.

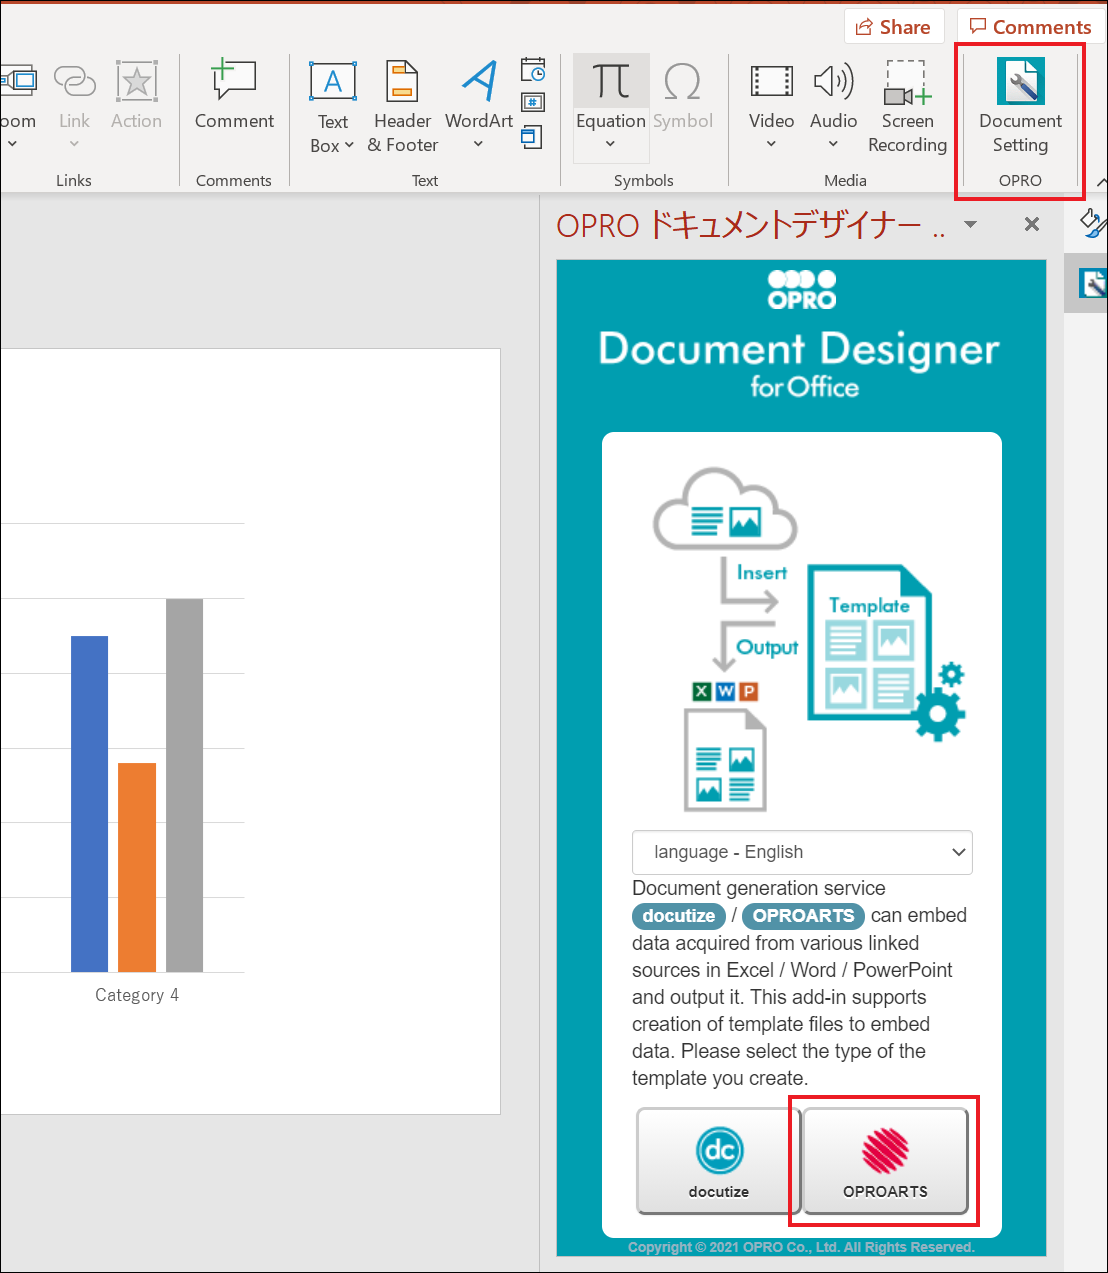
Adding this add-in shows the icon of it in "Insert" tab. Click it.
The start screen opens, so choose "OPROARTS".
2. Field Settings
What we want to create this time is a bar chart by month representing total amount of Salesforce's opportunities the phase of which is "Closed Won".
Choose a column chart from "Chart" menu in "Insert" tab and insert it.
(Choose from charts listed in "Kinds of Charts Available for PowerPoint File Output".)
"Category Name" is set for the horizontal axis as its default value. This time, we will set salesforce opportunity "Amount" for the vertical axis and the "Month" of close date for the horizontal axis.
To acquire "Amount" and "Month" data from Salesforce, enter "Amount,Month" into "Add fields" field and click "+" button.
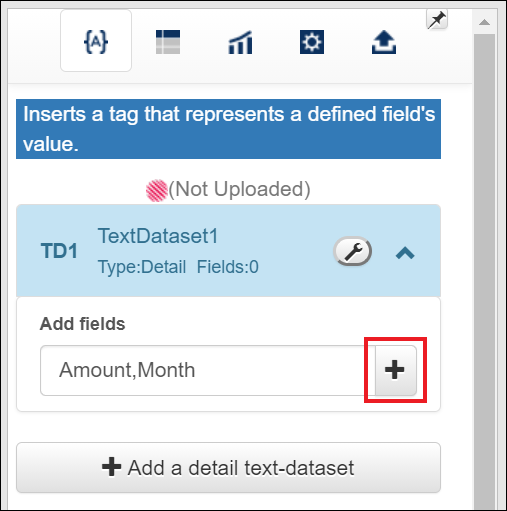
Fields are created. Change the data type of amount to "Number", not "Text". Leave the month field as it is.
Click a tab with a chart mark to open the chart settings tab.
Click "Add new definition".
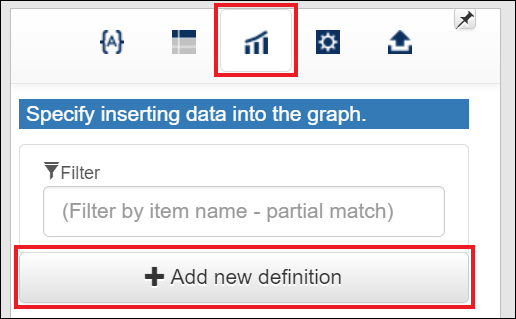
A chart definition is added. Scroll down a little bit and specify "Category" of the chart.
In case of a column chart, which has a horizontal axis (category) and a vertical axis, keep "Do not specify category name" unchecked.
Since "Category" is displayed in the horizontal axis, choose "Month".
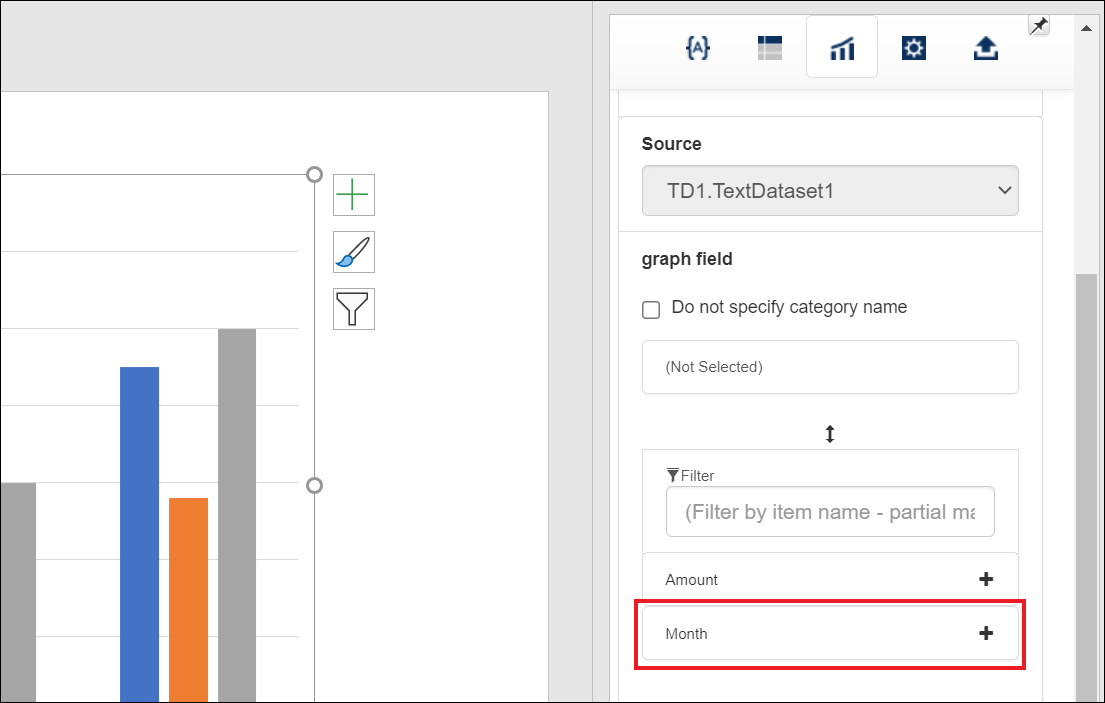
"Month" is set as category names (horizontal axis). Go on to select "Amount"
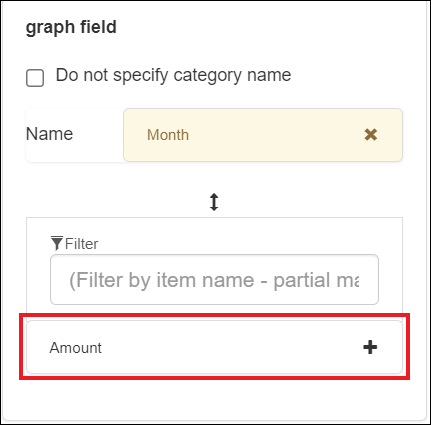
"Amount" is set as Data1. This makes amount appear in the chart.
Click the clip button to copy a tag that represents this chart settings.
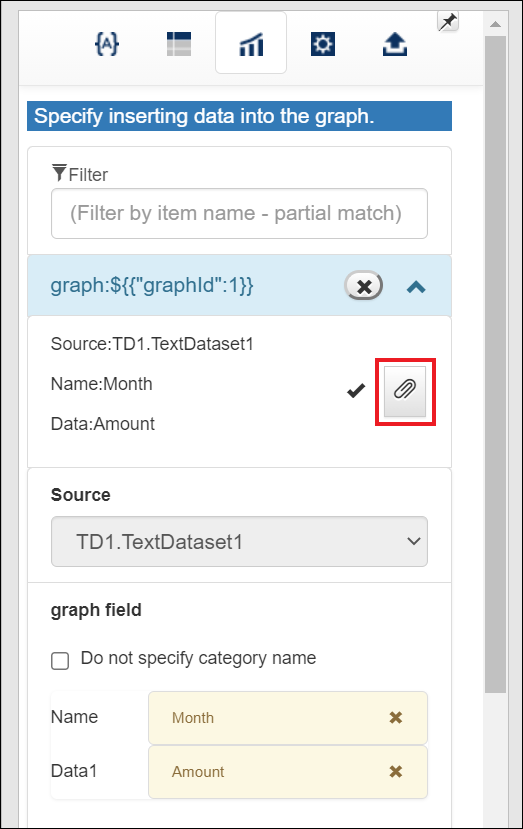
Paste the copied tag into the frame of the chart title.
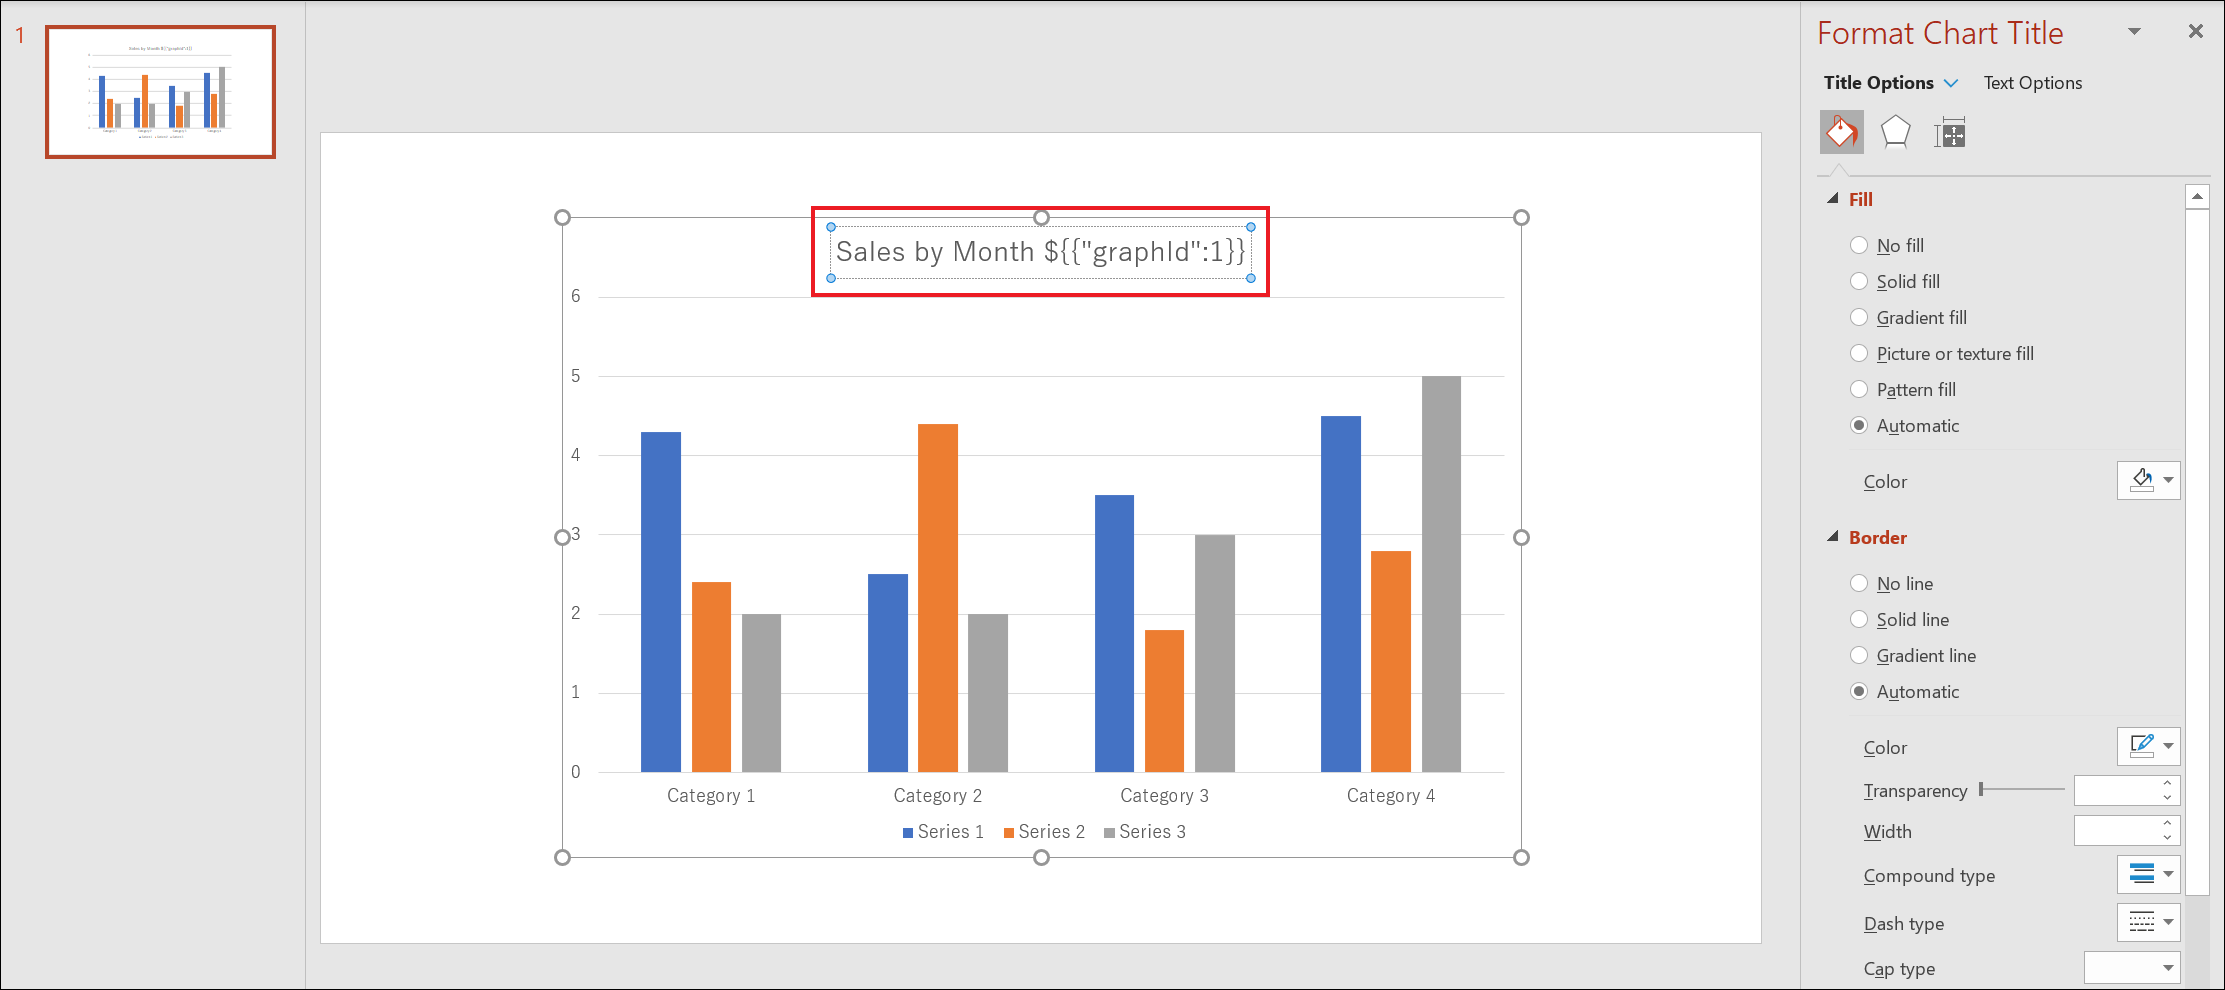
All setting are done!
Save this PowerPoint file and upload it to Designer.
Click the upload tab in the add-in and click "Open the upload form".
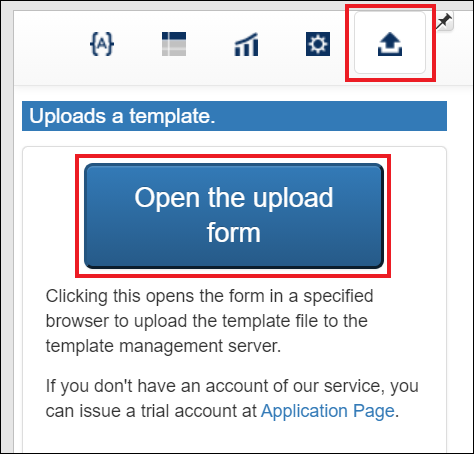
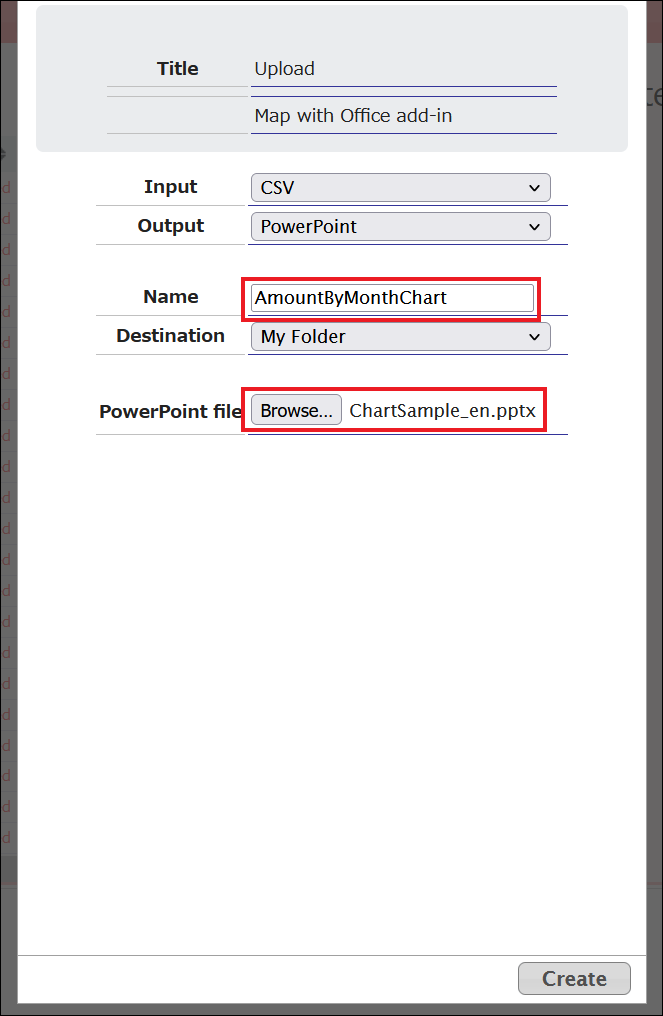
Name the template, attach the saved PowerPoint file and click "Create" at the lower-right corner to save.
* It is possible to reach the same upload menu by the following route.
In Salesforce "OPROARTS Connector" tab,
click [START] button > [Create New] button >"PowerPoint">"Upload"
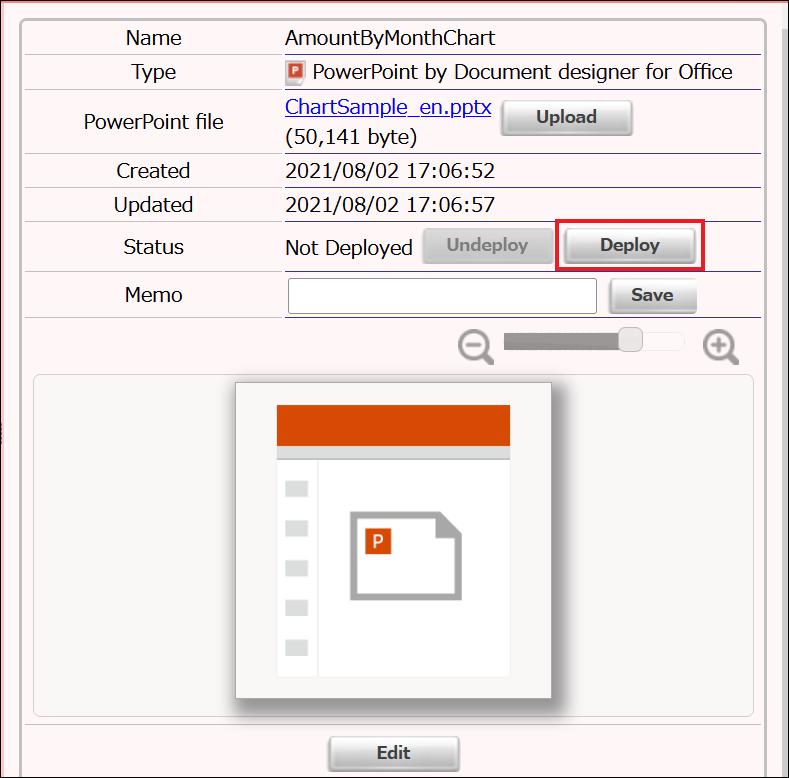
After the template is generated, click "Deploy" -> click "Deployment" to deploy the template to OPROARTS server.

3. ViewFramer Settings
Then, by using ViewFramer, let's retrieve "Amount" and "Month" from "Opportunities" whose stages are "Closed Won"!
【ViewFramer Login】
Log in to ViewFramer from this page. You need to enter CID, UID and UPW.
https://vfui.ap.oproarts.com/view_framer_ui/
【Create View】
Let's create a view for a list.
Configure so that the following data will be retrieved.
* Aggregated value of "Amount" by "Close Date" month about Salesforce Opportunities which stage names are "Closed Won".
1. In "Views" tab, click "New" button and log in to Salesforce, then name the view. (Only half-width alphabets or numbers are allowed)
2. In "Relation Settings", set "Opportunity" as a main object. Enter another name in the next input space. (e. g. Opp)
No related object is necessary, so click [ - ] button to delete a row.
3. In "Output Item Settings", set "Month" and "Amount".
(1) Month
Click "Item Builder" and click "Add Item" to add "Close Date".
User FORMAT_DATE function to extract year/month of the close date.
FORMAT_DATE(CloseDate,'yyyy/M')
(2) Amount
Click "Item Builder" and enter "SUM( )", then add "Amount" into it from "Add Item" button.
SUM(Amount)
(3) Change each output item name to "Month" and "Amount".
(4) Set "1" (half-width) for the group order of "Month".
4. In "Output Conditions", add the condition that means "Stage is Closed Won".
Click [ + ] button to add a row for a condition, then set the following equation.
Stage Equal(=) Fixed Value 'Closed Won'
After completing the settings, click "Save" button at the lower-right corner.
[Create Mapping]
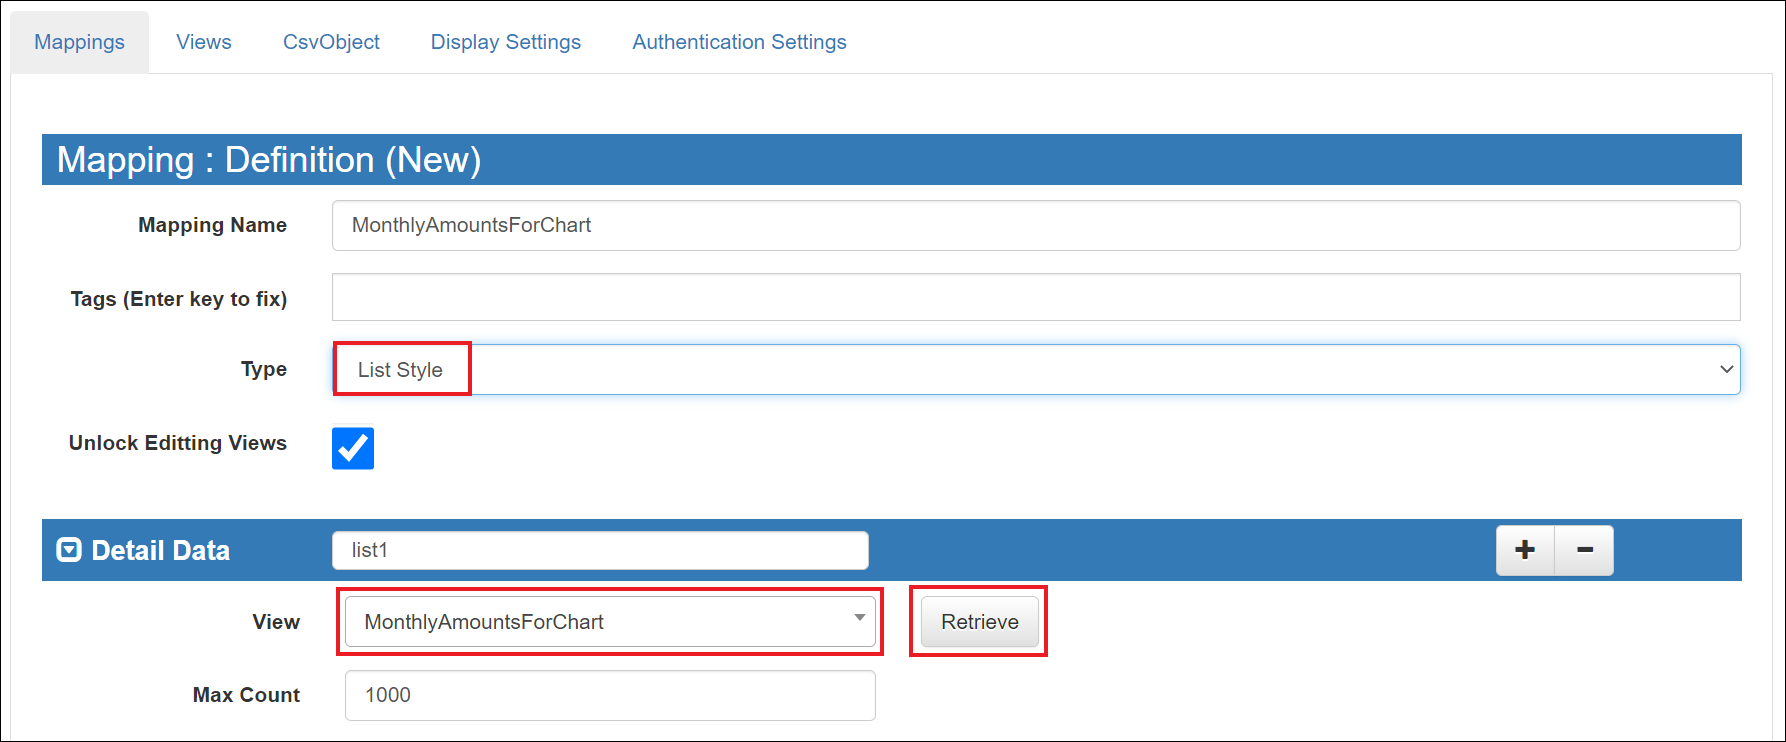
Click "New" button in "Mappings" tab, and name the new mapping. (Only half-width alphabets or numbers are allowed)
Change the value of "Type" from "Header-Details Style" to "List Style".
Select the view you created from the drop-down list, then click "Retrieve" button.
After the view's data is retrieved, click "Next" at the lower-right corner.
Then click "Continue Current Session".
Open "Documentizer" tab, select the PowerPoint template you deployed for "Templates".
Scroll down till the end and click "Auto Mapping".
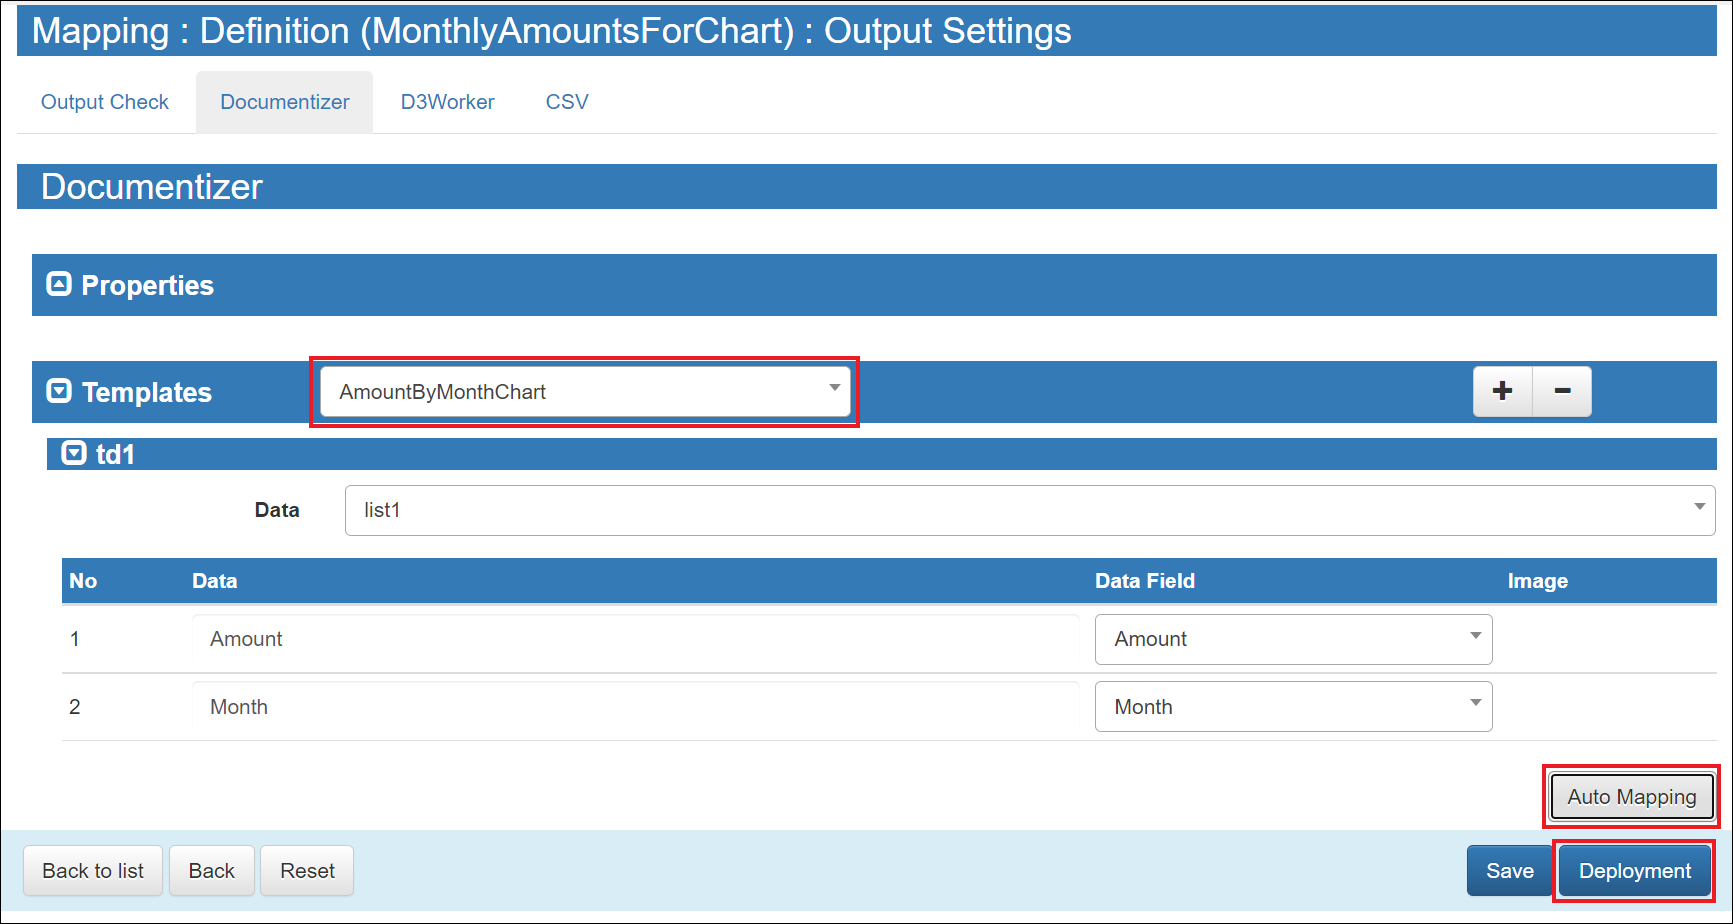
This action links the template fields with the view output items.
Click "Deployment".
Now, you completed mapping settings!
4. Create an Output Button
In mapping list page, click the "API Samle" button of the created mapping.

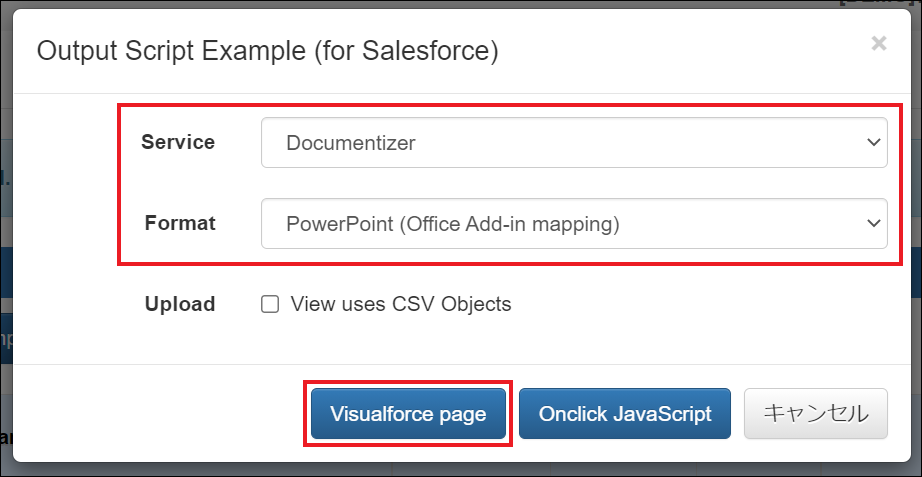
Select "Documentizer", "PowerPoint[Office Add-in mapping]" and click "Visualforce page" button, and a VIsualforce page sample file (used for an PowerPoint file output button in Lightning Experience screen) can be downloaded.
Then, you may edit the downloaded file about the following 2 points. (Optional)
a.
Delete lines after
</apex:page><!-- END -->
b. Change some Japanese contents in the file into English ones.
before
<div class="slds-scope">
    <div class="slds-p-vertical_x-small">
        <h1 class="slds-text-heading_small">実行しています...</h1>
        <p class="slds-text-body_regular">
            <a href="#" onclick="submitAction();">自動的に開始されない場合はこのリンクをクリックしてください。</a>
        </p>
    </div>
</div>
after
<div class="slds-scope">
    <div class="slds-p-vertical_x-small">
        <h1 class="slds-text-heading_small">Processing...</h1>
        <p class="slds-text-body_regular">
            <a href="#" onclick="submitAction();">Unless the process automatically starts, click this link.</a>
        </p>
    </div>
</div>
before
function submitAction() {
    /* if (!window.confirm('実行しますか?')) { return; } */
after
function submitAction() {
    /* if (!window.confirm('Run anyway?')) { return; } */
Put an PowerPoint file output button on the detail screen of Opportunity object in the following steps.
1. Create a Visualforce page
- Open [Visualforce Pages] in Salesforce [Setup].
- Click [New].
- Enter whatever name you like in [Label], [Name].
- Check [Available for Lightning Experience, Experience Builder sites, and the mobile app].
- Paste the contents in the file you edited into [Visualforce Markup].
- Click [Save].
※If package "OPROARTS Connector v2" is installed on your salesforce org, add the parameter below into "VIEWFRAMER.action" in the Visualforce page.
nsPrefix:"oproarts1",
2. Create a custom action
- Open [Object Manager] from Salesforce [Setup].
- Go to the setting home page of the object on which you will put a button.
- Open [Buttons, Links, and Actions].
- Click [New Action].
- Select [Custom Visualforce] for [Action Type].
- Select the page you created for [Visualforce Page].
- Specify a text for [Label] that is displayed on the button surface.
- Enter whatever name you like for [Name].
3. Put it on a layout
- Go back to the object setting home screen on which you will put a button.
- Open [Page Layout].
- [Edit] the page layout on which you will put a button.
- Select the button you created from [Mobile & Lightning Actions], and place it in the section [Salesforce Mobile and Lightning Experience Actions].
- Click [Save].
Open an opportunity record (any opportunity record is ok!), click the output button, then you can output a PowerPoint file!
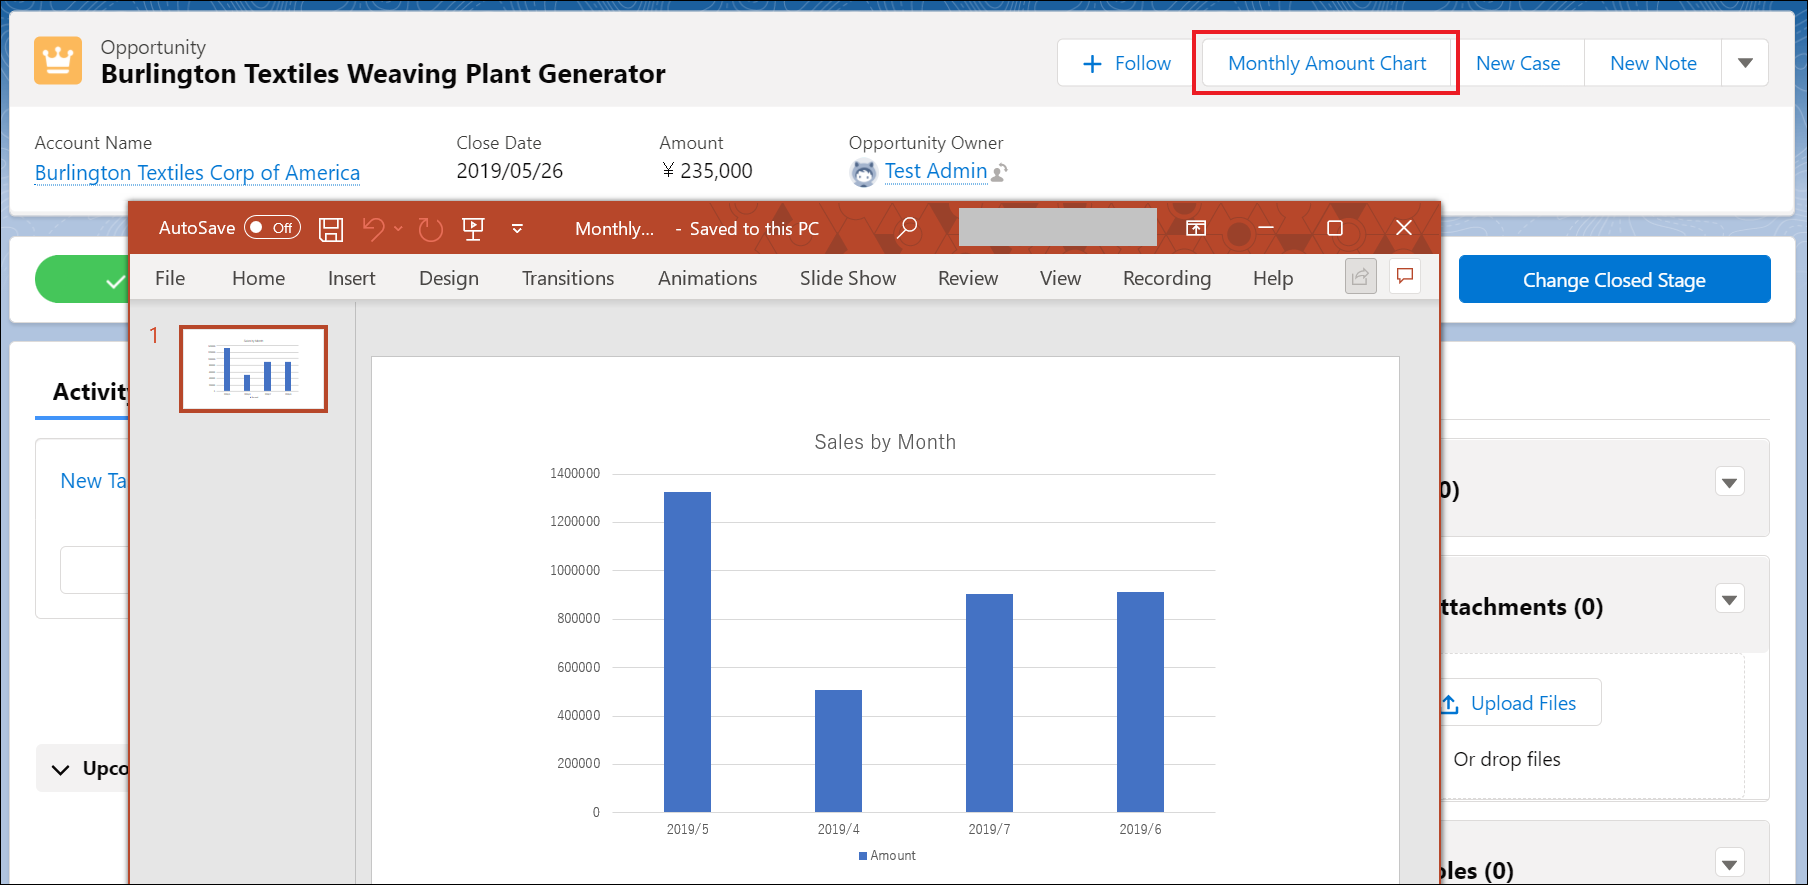
This time, we used a simple chart as an example.
You can also use functions such as SUMIF to aggregate amounts by category, and insert a line chart, a pie chart, etc.
The template sample introduced in this article is attached to the bottom of this article.
You can use it freely, so don't hesitate to use it if you want to.
