It is possible to insert charts based on data in Salesforce, kintone, or CSV file into PowerPoint forms.
-
Availability of each chart is described below.
Availability Charts Available Column, Line, Pie, Bar, Area, X Y(scatter, except for scatter with 3-D effects), Surface, Radar, Combo Unavailable X Y(scatter with 3-D effects), Map, Stock, Treemap, Sunburst, Histogram, Box & Whisker, Waterfall, Funnel -
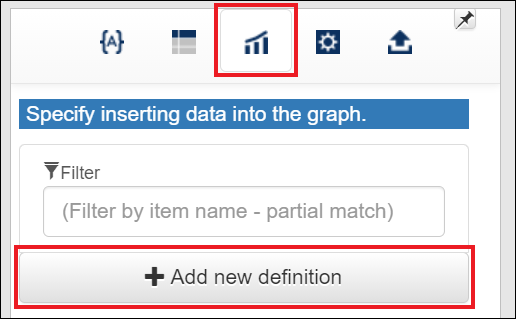
To apply data to a chart, click the icon below to open a chart definition creation tab.
-
Click "Add new definition" button to create a definition.
-
Select from the "Source" section a Text Dataset from which data will be acquired.
-
Specify in the "graph field" section the source fields the value of which will be used in the charts that will be inserted.
-
Check status of "Do not specify category name" determines how the selected field at the top is handled.
- If checked, values of the selected field at the top will be handled as category names.
- If not checked, values of the selected field at the top will be handled as data.
In this case, successive numbers from 1 will be set as category names.
-
If you insert data into a X Y(scatter, except for scatter with 3-D effects) chart, you need to match the number of the fields defined in the chart to the number of the fields the value of which will be inserted.
You may adjust the definition of a X Y chart to use.
-
-
Link the chart definition to the chart.
-
Click a clip button
 to copy a tag that inserts the chart definition.
A text like${{"graphId":1}}will be copied. -
Paste the tag into the chart.
Paste into either the title of the chart or the alt text of it.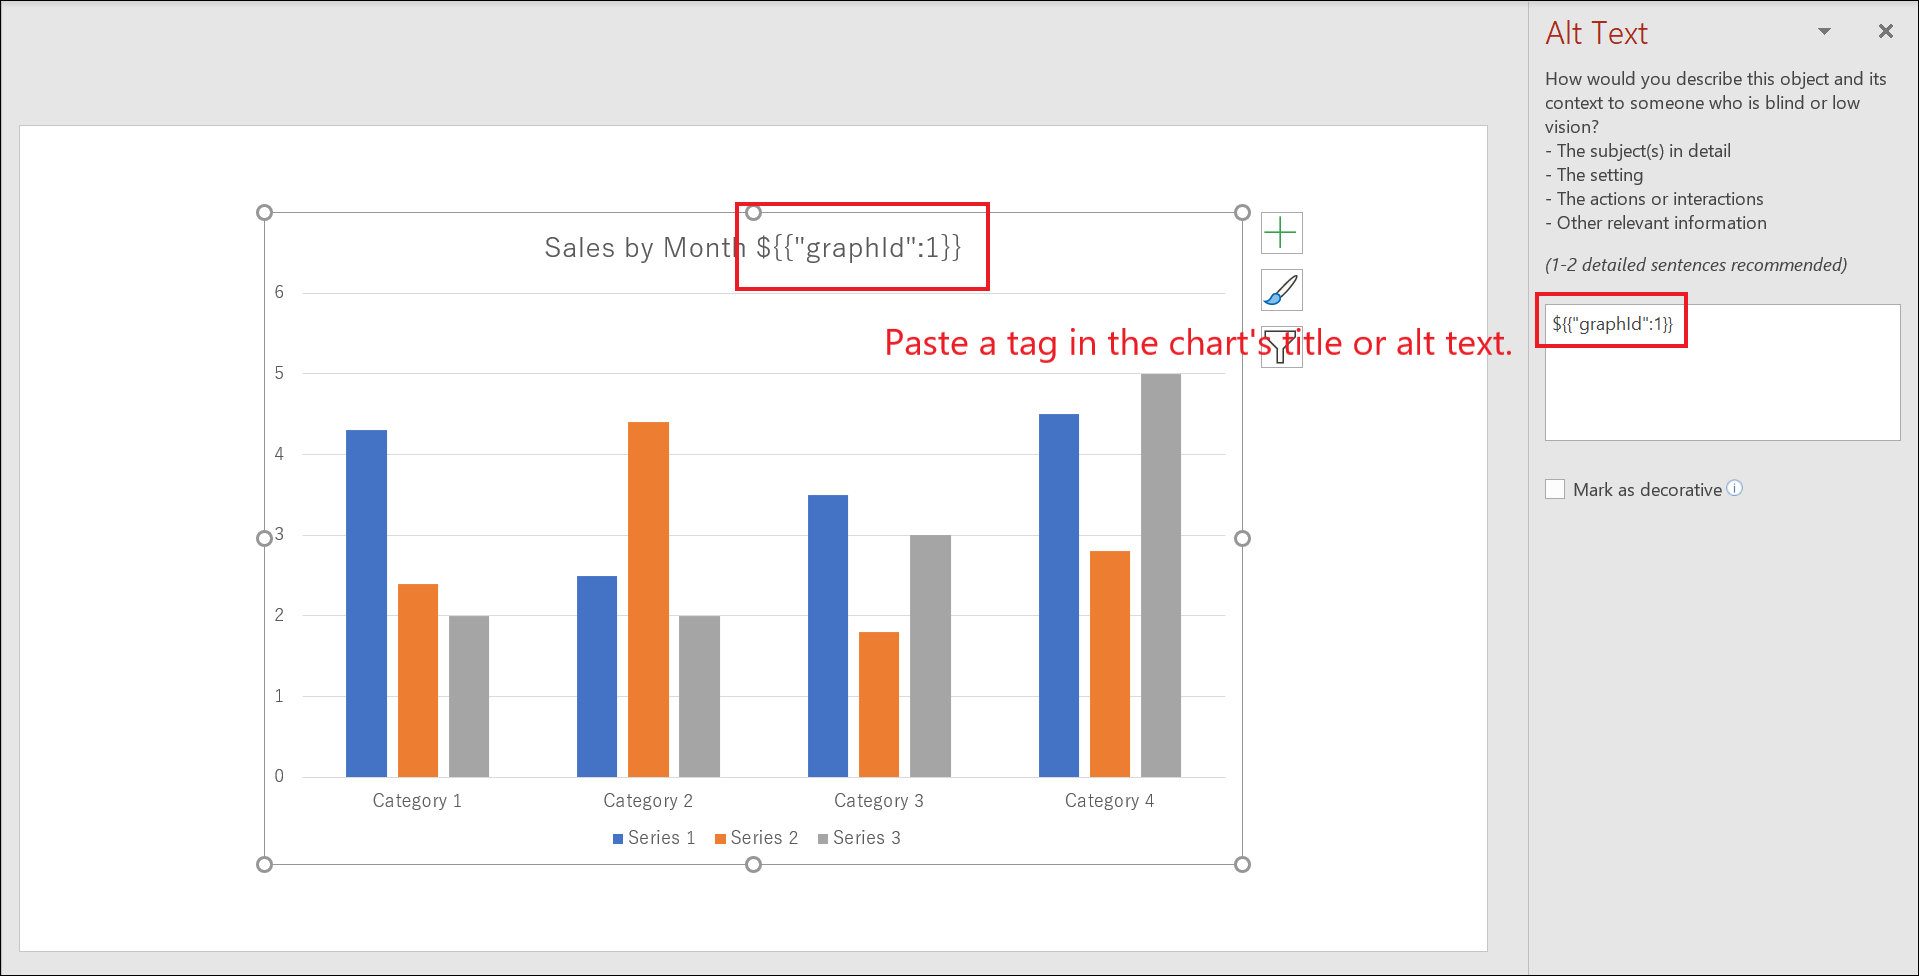
- Now, linking is complete. Give it a try to output PowerPoint files.
-
-
The maximum number of data that can be inserted into charts is 1,048,575.
-
If the number of data that can be inserted into charts exceeds 10,000, a PowerPoint file will be output while chart appearances are not displayed.
Open the generated file with PowerPoint app, right-click the target chart, then click "Edit Data". This action displays its appearance with retrieved data reflected.